Correlating SARS-CoV-2 Antigen Rapid Test Results with Viral Culture: A Critical Analysis for Research and Development
This article provides a comprehensive overview of SARS-CoV-2 Antigen Rapid Diagnostic Test (Ag-RDT) correlation studies with the gold-standard of cell culture infectivity.
Correlating SARS-CoV-2 Antigen Rapid Test Results with Viral Culture: A Critical Analysis for Research and Development
Abstract
This article provides a comprehensive overview of SARS-CoV-2 Antigen Rapid Diagnostic Test (Ag-RDT) correlation studies with the gold-standard of cell culture infectivity. Tailored for researchers, scientists, and drug development professionals, it explores the foundational virological principles linking antigen detection to viable virus, details methodological frameworks for conducting correlation assays, addresses common pitfalls and optimization strategies, and validates findings through comparative analysis with molecular and sequencing data. The synthesis offers critical insights for assay development, clinical interpretation, and public health policy.
The Virological Basis: Linking Ag-RDT Detection to Infectious Viral Load
1. Introduction & Context Within the broader thesis on SARS-CoV-2 Antigen Rapid Diagnostic Test (Ag-RDT) performance validation, establishing the correlation between antigen detection and the presence of culturable virus is paramount. This relationship directly informs the clinical and public health utility of Ag-RDTs, differentiating between early/active infection (with transmission risk) and residual viral RNA or protein shedding post-infectious period. This application note details protocols and analyses for correlating Ag-RDT results with cell culture-based virus isolation.
2. Quantitative Data Summary: Key Published Correlations Recent studies consistently demonstrate that Ag-RDT positivity strongly correlates with high viral loads, which in turn are associated with the presence of culturable virus. The following table summarizes critical quantitative findings.
Table 1: Correlation between Antigen Test Positivity, Viral Load, and Cell Culture
| Study (Reference) | Sample Size (n) | Ag-RDT Used | Ct Value Threshold for High Culture Probability | Culture Positivity Rate in Ag-RDT+ Samples | Culture Positivity Rate in Ag-RDT- Samples | Key Finding |
|---|---|---|---|---|---|---|
| van Kampen et al., 2021 | 106 | SD Biosensor | Ct < 25 | 95% | 2% | Infectivity reduced sharply for Ct > 25. |
| Pickering et al., 2022 | 210 | Innova SARS-CoV-2 | Ct < 23.5 | 91.3% | Not Reported | Ag-RDT sensitivity for culturable virus was >90%. |
| Pekosz et al., 2021 | 328 | BinaxNOW | Ct < 30 | 74% (Ct<25: 96%) | <5% | High Ag-RDT sensitivity for samples with Ct ≤ 30. |
| de Michelena et al., 2023 | 150 | Multiple | Ct < 24.7 | 88% | 0% | Culture probability <5% when Ct > 30. |
3. Experimental Protocols
3.1. Protocol: Parallel Ag-RDT and Viral Culture from Clinical Specimens Objective: To determine the correlation between Ag-RDT positivity and the isolation of replication-competent SARS-CoV-2 in cell culture from the same nasopharyngeal swab sample. Materials: See "Scientist's Toolkit" (Section 5). Procedure:
- Sample Collection: Collect nasopharyngeal swab in universal transport medium (UTM). Process within 24 hours (store at 4°C).
- Ag-RDT Testing: Aliquot 100-300 µL (per manufacturer) of UTM for Ag-RDT. Perform test strictly per IFU. Record result (positive/negative) and, if available, test line intensity.
- Sample Inactivation (Biosafety Consideration): For BSL-2 culture labs, treat an aliquot of the original sample with 0.1% Triton X-100 (v/v) for 15 min at room temperature to inactivate virus while preserving antigen for PCR. Note: For viral culture, do not inactivate.
- Cell Culture Preparation: Seed Vero E6 or Vero E6-TMPRSS2 cells in 24-well plates to achieve 80-90% confluence at time of inoculation.
- Virus Inoculation: Gently vortex sample UTM. Dilute 1:2 in serum-free infection medium (e.g., DMEM with Antibiotic-Antimycotic). Aspirate medium from cells. Inoculate cells with 300-500 µL of diluted sample in duplicate wells. Include positive (SARS-CoV-2 stock) and negative (UTM only) controls.
- Adsorption & Maintenance: Incubate inoculated plate at 37°C, 5% CO2 for 1-2 hours with gentle rocking every 15 min. After adsorption, add 1 mL of maintenance medium (e.g., DMEM with 2% FBS, Antibiotic-Antimycotic).
- Observation & Harvest: Monitor cells daily for cytopathic effect (CPE) for up to 7 days. Harvest 200 µL of supernatant from each well at 72-96 hours post-infection for sub-genomic RNA (sgRNA) RT-qPCR analysis, a marker of active replication.
- Blind Passage: If no CPE is observed by day 7, perform a blind passage by harvesting supernatant, clarifying, and inoculating onto fresh cells. Observe for another 7 days.
- Culture Positivity Definition: A sample is considered culture-positive if either: a) Characteristic CPE is observed, OR b) sgRNA RT-qPCR from harvested supernatant is positive above a defined threshold.
3.2. Protocol: sgRNA RT-qPCR to Confirm Viral Replication Objective: To objectively confirm active viral replication in cell culture, complementing CPE observation. Procedure:
- RNA Extraction: Extract RNA from 140 µL of harvested cell culture supernatant using a commercial kit (e.g., QIAamp Viral RNA Mini Kit).
- RT-qPCR Setup: Use a one-step RT-qPCR master mix. Primers/probes targeting the E gene and a sgRNA-specific primer set (e.g., targeting the leader sequence of subgenomic N transcript) are required.
- Cycling Conditions: 50°C for 15 min (reverse transcription); 95°C for 2 min; 45 cycles of 95°C for 3 sec, 60°C for 30 sec (data acquisition).
- Analysis: A sample is positive for replication if the sgRNA target amplifies with a Ct value significantly lower than the genomic E gene target at later time points, or above the limit of detection in a validated assay.
4. Diagrams & Visualizations
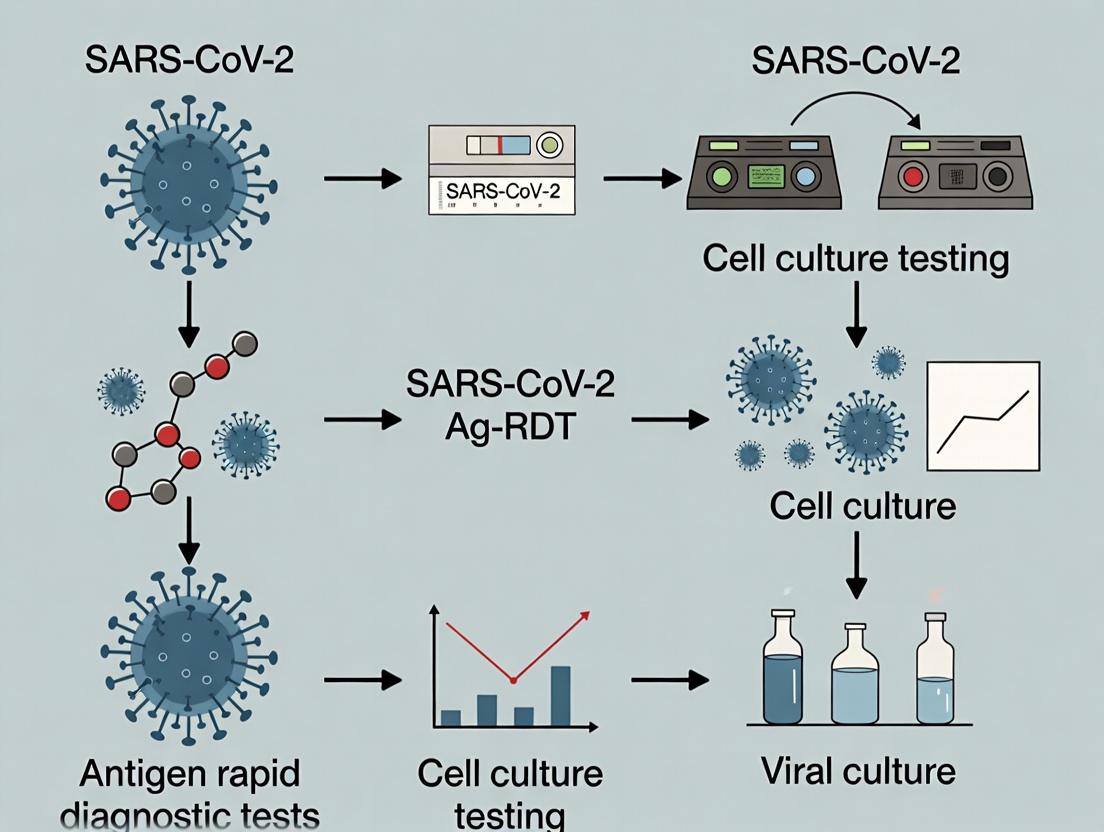
Title: Experimental Workflow for Ag-RDT vs. Culture Correlation
Title: Logical Relationship: Viral Load, Antigen, Culture, and Transmission
5. The Scientist's Toolkit: Essential Research Reagents & Materials Table 2: Key Research Reagent Solutions for Correlation Studies
| Item | Function/Application | Example Product/Type |
|---|---|---|
| Vero E6 Cells | Standard cell line highly permissive to SARS-CoV-2 infection. | ATCC CRL-1586 |
| Vero E6-TMPRSS2 Cells | Engineered to express TMPRSS2, enhancing virus entry for certain variants. | JCRB 1819 |
| Universal Transport Medium (UTM) | Preserves viral integrity for both antigen detection and culture. | Copan UTM |
| SARS-CoV-2 Ag-RDT | The device under evaluation. Critical to use according to IFU. | e.g., BinaxNOW, SD Biosensor |
| sgRNA-Specific Primer/Probe Set | For RT-qPCR confirmation of active viral replication in culture. | e.g., Charité-Berlin protocol targeting leader-N sequence |
| One-Step RT-qPCR Master Mix | For sensitive detection of viral genomic and subgenomic RNA. | TaqPath 1-Step, Luna Universal |
| Triton X-100 | For sample inactivation prior to RNA extraction/PCR in BSL-2 settings. | Laboratory-grade detergent |
| Cell Culture Maintenance Medium | Supports cell viability during prolonged infection assays. | DMEM + 2% FBS + Antibiotic-Antimycotic |
This application note details critical methodologies for characterizing SARS-CoV-2 infection kinetics, with a focus on correlating antigen (Ag) detection by Rapid Diagnostic Tests (Ag-RDTs) with culturable virus. The data and protocols herein support the central thesis that Ag-RDT sensitivity is intrinsically linked to the temporal dynamics of viral replication, specifically the phases of peak infectivity and antigen shedding, which precede the host's adaptive immune response.
Table 1: Temporal Dynamics of SARS-CoV-2 Infection in Upper Respiratory Tract
| Parameter | Median Time Post-Symptom Onset (Days) | Range/Notes | Primary Detection Method |
|---|---|---|---|
| Peak Viral RNA Load | 2 - 3 days | Can precede symptoms; lasts ~5 days | RT-qPCR (Ct values) |
| Peak Infectious Virus (Cell Culture) | 0 - 3 days | Rapid decline after day 5-7 in mild cases | Tissue Culture Infectious Dose (TCID₅₀) |
| Peak Nucleocapsid (N) Antigen Load | 1 - 5 days | Closely parallels culturable virus window | Ag-RDT, ELISA, Luminescence Immunoassay |
| Effective Antigen Shedding Window for Ag-RDT | 1 - 7 days | High positivity >90% in first week; declines rapidly thereafter | Clinical Ag-RDT evaluation |
| Last Detection of Culturable Virus | ~7 - 10 days | Rare beyond day 9 in immunocompetent | Virus Isolation in Cell Culture |
Table 2: Correlation Between Assay Metrics in Early Infection (<7 Days)
| Assay Comparison | Correlation Coefficient (Approx.) | Key Implication |
|---|---|---|
| TCID₅₀ vs. RT-qPCR (Ct) | Strong Inverse (Ct<25 ~high titer) | Low Ct values (<25-28) often indicate presence of culturable virus. |
| Ag-RDT Positivity vs. TCID₅₀ | High (>90% when TCID₅₀ >10⁴-⁵/mL) | Ag-RDTs are effective surrogates for identifying peak infectivity. |
| Ag-RDT Positivity vs. High RNA Load (Ct<25) | Very High (>98%) | Antigen positivity is a reliable marker of high viral replication. |
Detailed Experimental Protocols
Protocol 1: Longitudinal Virus Culture and Titration from Clinical Specimens
Objective: To quantify infectious SARS-CoV-2 titer over time and define the window of peak infectivity.
- Specimen Collection & Processing: Collect serial nasopharyngeal swabs in viral transport media (VTM). Centrifuge at 800xg for 5 min to clarify. Aliquot and store at -80°C.
- Cell Culture Preparation: Seed Vero E6 or Calu-3 cells in 96-well tissue culture plates 24h prior, to achieve 90-95% confluency.
- Virus Titration (TCID₅₀):
- Prepare 10-fold serial dilutions of specimen supernatant (10⁻¹ to 10⁻⁶) in infection medium.
- Aspirate medium from cell plates. Infect 8 replicate wells per dilution with 100µL inoculum. Include cell-only controls.
- Incubate at 37°C, 5% CO₂ for 5-7 days.
- Score wells for cytopathic effect (CPE). Calculate TCID₅₀/mL using the Reed & Muench or Spearman-Kärber method.
- Analysis: Plot log₁₀(TCID₅₀/mL) vs. days post-onset. The peak and duration of culturable virus define the high-transmission risk period.
Protocol 2: Parallel Antigen Quantification and Ag-RDT Testing
Objective: To correlate viral culture data with antigen load measured by Ag-RDT and quantitative immunoassay.
- Sample Preparation: Use the same clarified VTM aliquots from Protocol 1.
- Ag-RDT Testing: Perform according to manufacturer's instructions (e.g., Abbott BinaxNOW, SD Biosensor Standard Q). Use fresh aliquots. Record result and line intensity visually or via reader.
- Quantitative Antigen ELISA/LIA:
- Plate Coating: Coat high-binding plates with anti-SARS-CoV-2 N-protein capture antibody overnight at 4°C.
- Blocking: Block with 5% BSA in PBS-T for 1h at RT.
- Sample & Standard: Add clinical specimen dilutions and recombinant N-protein standard curve. Incubate 2h at RT.
- Detection: Add detection antibody (biotinylated), then streptavidin-HRP. Develop with TMB substrate. Stop with H₂SO₄.
- Readout: Measure absorbance at 450nm. Interpolate antigen concentration (pg/mL) from standard curve.
- Correlation Analysis: Plot Ag concentration or Ag-RDT intensity score vs. TCID₅₀/mL and RT-qPCR Ct value for each time point.
Visualizations
Title: SARS-CoV-2 Replication Cycle & Detection Points
Title: Workflow for Correlating Viral Load, Culture & Antigen
The Scientist's Toolkit: Research Reagent Solutions
Table 3: Essential Materials for Viral Dynamics & Correlation Studies
| Item/Category | Example Product/Type | Function in Research |
|---|---|---|
| Cell Lines for Isolation | Vero E6, Vero E6-TMPRSS2, Calu-3 | Permissive cells for SARS-CoV-2 culture and titration. |
| Viral Transport Media (VTM) | Copan UTM, PBS-based formulations | Stabilizes virus and host cells in clinical specimens during transport. |
| Quantitative Antigen Standard | Recombinant SARS-CoV-2 Nucleocapsid (N) Protein | Creates standard curve for precise quantification of antigen load in assays. |
| Capture/Detection Antibody Pair | Anti-SARS-CoV-2 N-protein mAbs (e.g., from Sino Biological, Thermo Fisher) | Critical components for developing in-house quantitative ELISA/LIA. |
| Clinical-Grade Ag-RDTs | Abbott BinaxNOW, SD Biosensor Standard Q | Benchmark point-of-care tests for correlative sensitivity studies. |
| RNA Extraction & RT-qPCR Kits | QIAamp Viral RNA Mini Kit, TaqPath COVID-19 RT-PCR Kit | Gold-standard measurement of viral RNA load (Ct value). |
| Inactivation Buffer | AVL Buffer (Qiagen), Triton X-100 based buffers | Inactivates virus for safe downstream molecular and antigen testing. |
The Role of Viral Variants and Mutations in Antigen-Antibody Binding.
This application note details the experimental protocols and analytical frameworks for investigating the impact of SARS-CoV-2 variants on the performance of Antigen Rapid Diagnostic Tests (Ag-RDTs). Within the broader thesis on SARS-CoV-2 Ag-RDT and cell culture correlation testing, this document focuses on the biochemical basis for potential test sensitivity shifts due to mutations in the viral nucleocapsid (N) and spike (S) proteins, which are the primary targets for diagnostic and therapeutic antibodies, respectively.
Key Variants and Mutations of Concern
The following table summarizes key SARS-CoV-2 variants, their defining mutations in antigen-relevant proteins, and their documented or hypothesized impact on immunoassay performance.
Table 1: Impact of SARS-CoV-2 Variants on Antigen-Antibody Binding
| Variant (Pango Lineage) | Key N Protein Mutations | Key S Protein Mutations | Impact on Ag-RDT (N-target) | Impact on mAb Binding (S-target) |
|---|---|---|---|---|
| Omicron BA.1 (B.1.1.529) | P13L, Δ31-33, R203K, G204R | A67V, Δ69-70, T95I, G142D, Δ143-145, Δ211, L212I, ins214EPE, G339D, S371L, S373P, S375F, K417N, N440K, G446S, S477N, T478K, E484A, Q493R, G496S, Q498R, N501Y, Y505H, T547K, D614G, H655Y, N679K, P681H, N764K, D796Y, N856K, Q954H, N969K, L981F | Minimal reported impact on most tests; Δ31-33 may affect some mAb epitopes. | Major reduction/escape from most therapeutic mAbs (e.g., Bamlanivimab, Casirivimab, Imdevimab). Retains binding to Sotrovimab and newer generation mAbs. |
| Omicron BA.2 (B.1.1.529.2) | P13L, Δ31-33, R203K, G204R | T19I, L24S, Δ25-27, G142D, V213G, G339D, S371F, S373P, S375F, T376A, D405N, R408S, K417N, N440K, S477N, T478K, E484A, Q493R, Q498R, N501Y, Y505H, D614G, H655Y, N679K, P681H, N764K, D796Y, Q954H, N969K | Similar to BA.1. Specific epitope changes may differentiate mAb binding in assays. | Similar escape profile to BA.1, with some differential binding due to S371F change. |
| Omicron BA.5 (B.1.1.529.5) | P13L, Δ31-33, R203K, G204R | Identical to BA.2 except: Δ69-70, V213G→F, L452R, F486V, R493Q reversion. | Similar to BA.1/BA.2. L452R not in N protein. | L452R and F486V confer additional escape from some remaining mAbs, further narrowing therapeutic options. |
| XBB.1.5 (Recombinant) | P13L, Δ31-33, R203K, G204R | V83A, H146Q, Q183E, V213E, G252V, G339H, R346T, L368I, S371F, S373P, S375F, T376A, D405N, R408S, K417N, N440K, V445P, G446S, N460K, S477N, T478K, E484A, F486P, F490S, R493Q, Q498R, N501Y, Y505H, D614G, H655Y, N679K, P681H, N764K, D796Y, Q954H, N969K | Preserved Ag-RDT detection likely, though epitope changes present. | Extreme escape variant; evades all earlier therapeutic mAbs. Binds to newer mAbs like Sotrovimab and Bebtelovimab with reduced efficacy. |
| JN.1 (B.1.1.529.2.86.1.1) | P13L, Δ31-33, R203K, G204R | L455S, R346T, V1104L (additional to XBB.1.5 profile) | Preserved Ag-RDT detection likely. | L455S further potentiates immune escape, reducing neutralization by sera and newer mAbs. |
Experimental Protocols
Protocol 1: In Silico Epitope Mapping and Binding Affinity Prediction
Objective: To predict the impact of N protein mutations on monoclonal antibody (mAb) binding used in Ag-RDTs. Methodology:
- Structure Retrieval: Obtain high-resolution crystal structures of the SARS-CoV-2 N protein (or N-terminal domain) in complex with a diagnostic mAb from the Protein Data Bank (PDB: 7C2V, 7ACT).
- Mutation Introduction: Use molecular visualization/editing software (e.g., PyMOL, UCSF Chimera) to introduce specific variant mutations (e.g., Δ31-33, R203K) into the N protein structure.
- Energy Minimization: Perform a brief energy minimization (e.g., using GROMACS or Rosetta) to relieve steric clashes caused by the introduced mutations.
- Binding Affinity Calculation: Utilize a docking or binding energy calculation suite (e.g., HADDOCK, FoldX) to estimate the change in binding free energy (ΔΔG) between the wild-type and mutant N protein-mAb complex. A positive ΔΔG suggests weakened binding.
- Visualization: Generate models highlighting disrupted hydrogen bonds, steric hindrances, or electrostatic changes at the epitope-paratope interface.
Protocol 2: Surface Plasmon Resonance (SPR) for Binding Kinetics
Objective: To empirically measure the binding kinetics (KD, ka, kd) of variant N proteins against diagnostic mAbs. Methodology:
- Antigen Immobilization: Recombinant N proteins from reference (Wuhan-Hu-1) and variant strains (e.g., Omicron BA.5, XBB.1.5) are produced via HEK293 or Sf9 expression systems and purified.
- Sensor Chip Preparation: Using a Biacore or comparable SPR system, covalently immobilize a capture antibody (e.g., anti-His tag if antigen is His-tagged) on a CM5 sensor chip via amine coupling to ~10,000 RU.
- Capture Method: Dilute recombinant N antigens in HBS-EP+ running buffer. Inject each antigen sequentially over the capture surface for 60 seconds to achieve a consistent capture level (~100 RU).
- Kinetic Analysis: Inject a concentration series (e.g., 0.5 nM to 100 nM) of the diagnostic mAb (the analyte) over the captured N protein surface at a flow rate of 30 µL/min. Association is monitored for 180 sec, dissociation for 600 sec.
- Regeneration & Data Fitting: Regenerate the surface with a 30-second pulse of 10 mM glycine-HCl (pH 2.0). Double-reference the data and fit to a 1:1 Langmuir binding model to determine association rate (ka), dissociation rate (kd), and equilibrium dissociation constant (KD).
Protocol 3: Pseudovirus Neutralization Assay (for S Protein Impact)
Objective: To correlate S protein mutations with the efficacy of therapeutic mAbs and assess potential cross-reactivity of anti-S antibodies used in combo Ag-RDTs. Methodology:
- Pseudovirus Production: Generate lentiviral or vesicular stomatitis virus (VSV) pseudotypes bearing the S protein of relevant variants in a HEK293T cell line.
- Cell Culture: Seed susceptible cells (e.g., Vero E6 or ACE2-overexpressing HEK293T) in 96-well plates.
- Neutralization: Serially dilute therapeutic or test mAbs and incubate with a standardized titer of pseudovirus for 1 hour at 37°C.
- Infection & Readout: Add the mAb-pseudovirus mixture to cells. After 48-72 hours, quantify infection via luciferase or GFP reporter gene expression.
- Analysis: Calculate the half-maximal inhibitory concentration (IC50) for each mAb against each variant. Compare to the reference strain to determine fold-reduction in neutralization potency.
Visualizations
Title: Research Workflow for Variant Impact on Ag-RDTs
Title: Mutational Disruption of Antigen-Antibody Binding
The Scientist's Toolkit
Table 2: Key Research Reagent Solutions
| Item | Function in This Research | Example/Note |
|---|---|---|
| Recombinant Variant N/S Proteins | Essential antigens for direct binding assays (SPR, ELISA). Must be high purity, correctly folded. | HEK293-expressed, His-tagged for capture. Ensure inclusion of key variant mutations. |
| Diagnostic & Therapeutic mAbs | The binding partners for kinetic and neutralization studies. | Include mAbs used in commercial Ag-RDTs and FDA-approved therapeutics for comparison. |
| SPR Sensor Chips (Series S, CM5) | Gold-standard for label-free, real-time biomolecular interaction analysis. | CM5 chips allow for flexible ligand immobilization via amine, streptavidin, or capture coupling. |
| Pseudovirus System (lentiviral/VSV) | Safe, BSL-2 alternative for studying infectivity and neutralization of high-consequence variants. | Particles pseudotyped with variant S proteins, encoding a luciferase reporter. |
| ACE2-Expressing Cell Line | Target cells for pseudovirus neutralization assays, mimicking viral entry. | HEK293T-hACE2 or Vero E6 cells. |
| Cell Culture-Based Virus Isolates | For the correlation arm of the thesis: linking Ag-RDT signal to infectious virus titer. | Clinical isolates of variants, titrated on Vero E6 or similar cells (TCID50/mL). |
| HADDOCK / PyMOL / FoldX Software | Computational tools for predicting the structural impact of mutations on antibody binding. | Critical for initial risk assessment and guiding wet-lab experiment design. |
Application Notes: Correlating Antigen Detection with Viral Culturability
The central thesis of this research program posits that SARS-CoV-2 rapid antigen test (Ag-RDT) positivity can serve as a practical proxy for infectious virus shedding when viral loads exceed a defined threshold. This correlation is critical for informing isolation guidelines and understanding transmission dynamics. The data synthesized below supports the concept of an "infectivity threshold," typically correlating with Ct values ≤24-25 or RNA copy numbers ≥10^6 - 10^7 copies/mL.
Table 1: Correlation Between Ag-RDT Positivity, PCR Cycle Threshold (Ct), and Cell Culture Positivity
| Study Reference (Key Finding) | Ag-RDT Used | PCR Assay Target | Mean Ct for Culture-Positive Samples | Ag-RDT Positive Predictive Value (PPV) for Culturability (at Ct ≤25) | Estimated Viral Load Threshold for Culturability (RNA copies/mL) |
|---|---|---|---|---|---|
| Jaafar et al., 2021 (Virus isolation correlates with Ct) | Not Specified | E gene | 19.95 (Culture+) vs. 26.11 (Culture-) | High (Near 100% for Ct<20) | ≥ 3.16 × 10^6 |
| van Kampen et al., 2021 (Infectious virus in clinical samples) | SD Biosensor | E, RdRp genes | ≤ 22.3 (100% Culture+) | >90% for Ct < 22 | ≥ 1 × 10^7 |
| Pickering et al., 2022 (Sensitivity of Ag-RDT vs. Culture) | Innova SARS-CoV-2 Ag | RdRp gene (N1) | 21.2 (Ag+ & Culture+) | 92.3% | ~6.31 × 10^6 |
| Young et al., 2023 (Omicron BA.1 infectiousness) | Panbio COVID-19 Ag | N gene | 20.7 (Culture+) | 68% overall; >95% for Ct < 20 | Not Specified |
Table 2: Ag-RDT Clinical Sensitivity Relative to PCR Ct Value
| PCR Ct Value Range | Approximate Viral Load (RNA copies/mL) | Probability of Ag-RDT Positivity* | Probability of Virus Culture Positivity* | Inference on Infectivity |
|---|---|---|---|---|
| Ct ≤ 20 | ≥ 10^8 | Very High (>95%) | Very High (>90%) | High likelihood of infectious virus. |
| Ct 20 - 25 | 10^7 - 10^8 | High (~80-95%) | Moderate to High (Declining from ~80% to ~10%) | Infectivity present, declining with increasing Ct. |
| Ct 25 - 30 | 10^6 - 10^7 | Low to Moderate (<50%) | Very Low (<10%) | Unlikely to harbor infectious virus. |
| Ct ≥ 30 | ≤ 10^6 | Very Low (<5%) | Extremely Rare | Very unlikely to be infectious. |
*Probabilities are aggregated estimates from reviewed literature and may vary by specific assay and variant.
Experimental Protocols
Protocol 1: Parallel Testing of Clinical Specimens with Ag-RDT, qRT-PCR, and Viral Culture
Objective: To determine the relationship between Ag-RDT signal strength, viral RNA load, and the presence of culturable SARS-CoV-2.
Materials:
- Nasopharyngeal or anterior nasal swab specimens in viral transport media (VTM).
- Commercial SARS-CoV-2 Ag-RDT (e.g., Abbott BinaxNOW, SD Biosensor Standard Q).
- RNA extraction kit and qRT-PCR reagents targeting SARS-CoV-2 N or RdRp genes.
- Vero E6 or Vero E6/TMPRSS2 cell line.
- Cell culture maintenance media (DMEM + FBS + Pen/Strep).
- Biosafety Level 3 (BSL-3) laboratory facility.
Methodology:
- Specimen Processing: Aliquot the VTM specimen into three parts: one for immediate Ag-RDT testing, one for RNA extraction, and one for virus culture (to be processed promptly or stored at -80°C).
- Ag-RDT Execution: Perform the Ag-RDT strictly per manufacturer's instructions. Record the result and, if possible, use a digital reader to obtain a semi-quantitative line intensity value.
- qRT-PCR Quantification: a. Extract RNA from 140 µL of VTM using a commercial kit. b. Run qRT-PCR in duplicate with a standard curve of known RNA copy numbers. c. Report result as Ct value and extrapolate to RNA copies/mL of transport media.
- Virus Isolation in Cell Culture (BSL-3): a. Prepare confluent monolayers of Vero E6 cells in 24-well plates. b. Inoculate duplicate wells with 100 µL of filtered (0.45 µm) specimen. Include positive (low-passage SARS-CoV-2) and negative (media only) controls. c. Incubate at 37°C, 5% CO2 for 1 hour for adsorption. d. Add 1 mL of maintenance media and incubate for up to 7 days. e. Observe daily for cytopathic effect (CPE). Perform sub-passaging or confirm presence of virus by qRT-PCR on supernatant at days 3-5 if no CPE is observed. f. A sample is considered culture-positive if CPE is observed and confirmed by PCR, or if PCR shows a significant increase in viral RNA in the supernatant.
Analysis: Correlate Ag-RDT result (and signal intensity) with both PCR Ct value and culture outcome using statistical models (e.g., ROC analysis) to determine predictive thresholds.
Protocol 2: Determining the Limit of Detection (LOD) for Culturability
Objective: To empirically establish the minimum infectious dose detectable by cell culture and compare it to Ag-RDT and PCR limits.
Materials:
- Cultured SARS-CoV-2 stock (titered by plaque assay or TCID50).
- Serial dilution tubes with culture media.
- Remaining materials as in Protocol 1.
Methodology:
- Virus Dilution: Perform a 10-fold serial dilution of the virus stock in culture media, covering a range from known high titer (e.g., 10^6 PFU/mL) to very low titer (e.g., 10^0 PFU/mL).
- Parallel Testing: For each dilution, simultaneously: a. Perform Ag-RDT using a spiked swab protocol. b. Extract RNA and run qRT-PCR to determine Ct/copy number. c. Inoculate onto Vero E6 cells (as in Protocol 1, step 4) to determine the last dilution yielding a positive culture.
- Endpoint Calculation: The LOD for culturability is defined as the highest dilution (lowest viral concentration) that results in a positive culture. Compare this value to the Ag-RDT manufacturer's LOD (in TCID50/mL or copies/mL) and the PCR's LOD.
Diagrams
Title: Workflow for Correlating Ag-RDT, PCR, and Culture Results
Title: Viral Load Dictates Ag-RDT and Culture Outcomes
The Scientist's Toolkit: Key Research Reagent Solutions
| Item | Function in Research | Key Considerations |
|---|---|---|
| Vero E6 / Vero E6-TMPRSS2 Cells | Permissive cell line for SARS-CoV-2 isolation and propagation. TMPRSS2 expression enhances infection by certain variants. | Check for mycoplasma contamination regularly. Use low passage numbers. |
| Viral Transport Media (VTM) | Preserves specimen integrity for downstream PCR and culture. | Use with compatible swabs (e.g., synthetic tip). Some formulations may inhibit certain Ag-RDTs; verify compatibility. |
| Commercial Ag-RDT Kits (e.g., Abbott, SD Biosensor) | Provide rapid, point-of-care detection of viral nucleocapsid (N) antigen. Used as the experimental comparator. | Batch-to-batch consistency is crucial. Use digital readers for objective, semi-quantitative signal measurement. |
| RNA Extraction Kits (Magnetic Bead or Column-Based) | Isolate high-quality viral RNA for sensitive qRT-PCR quantification. | Automated platforms improve throughput and consistency. Include internal extraction controls. |
| qRT-PCR Assay Mix (CDC N1/N2, WHO E-gene, etc.) | Quantifies viral RNA load, providing the Ct value gold standard. | Must include a reliable standard curve of known copy number for absolute quantification. |
| Plaque Assay Reagents (Agarose, Neutral Red) | The gold-standard method for titrating infectious virus (PFU/mL). | Requires BSL-3 facility. Time-consuming but provides direct measure of infectious units. |
| TCID50 Assay Reagents | Alternative to plaque assay for determining infectious virus titer. | Statistical endpoint calculation. Can be less variable than plaque assays for some virus stocks. |
| Virus Inactivation Buffer (e.g., AVL, Trizol) | For safe inactivation of specimens prior to RNA extraction outside BSL-3. | Must be validated to fully inactivate SARS-CoV-2 while preserving RNA integrity. |
Review of Seminal Studies Establishing the Ag-RDT/Culture Relationship
This application note synthesizes pivotal research investigating the correlation between SARS-CoV-2 rapid antigen test (Ag-RDT) positivity and positive viral cell culture. Within the broader thesis on SARS-CoV-2 diagnostics, establishing this relationship is critical, as positive culture is a key proxy for transmissible virus. This correlation informs public health guidance on isolation periods and the clinical utility of Ag-RDTs.
The following table consolidates quantitative findings from landmark studies that established the relationship between Ag-RDT results, PCR Cycle Threshold (Ct) values, and successful viral culture.
Table 1: Summary of Seminal Ag-RDT/Culture Correlation Studies
| Study (Primary Author, Year) | Sample Type | Key Ag-RDT Brand/Type | Culture Method | Critical Ct Value for Culture Positivity (Approx.) | Ag-RDT Sensitivity vs. Culture | Main Conclusion |
|---|---|---|---|---|---|---|
| Jaafar et al. (2021) | Nasopharyngeal | Panbio (Abbott) | Vero E6 cells | Ct < 25 | 95% for Ct < 25 | Ag-RDT positivity strongly correlates with presence of culturable virus. |
| van Kampen et al. (2021) | Nasopharyngeal | SD Biosensor STANDARD Q | Vero E6/TMPRSS2 cells | Ct < 27 | 96.4% for Ct ≤ 27 | Almost all Ag-RDT positives (Ct≤27) yielded replicating virus in culture. |
| Pickering et al. (2022) | Anterior Nasal & Throat | Innova SARS-CoV-2 Ag | Vero/hSLAM cells | Ct < 24.8 | >90% for Ct < 25 | Ag-RDT detectable antigen levels are a reliable marker of infectious virus. |
| Miyakawa et al. (2021) | Saliva | Espline SARS-CoV-2 | Vero E6/TMPRSS2 cells | Ct < 30 | High for Ct < 30 | Strong correlation found between Ag-RDT signal intensity and culture positivity rate. |
| Young et al. (2022) (Comparator) | Anterior Nasal | BD Veritor, BinaxNOW | Calu-3 & Vero E6 cells | Variable by variant | High near culture onset/peak | Ag-RDT performance tracks closely with the presence of culturable virus across variants. |
Detailed Experimental Protocols
Protocol 1: Parallel Ag-RDT, qRT-PCR, and Viral Culture from Clinical Specimens
Based on methodologies from Jaafar et al. and van Kampen et al.
Objective: To directly compare Ag-RDT results with viral culture outcome from the same patient specimen.
Materials:
- Fresh nasopharyngeal (NP) or anterior nasal swab in viral transport medium (VTM).
- Commercial Ag-RDT kit (e.g., Panbio COVID-19 Ag Rapid Test).
- RNA extraction kit and qRT-PCR reagents for SARS-CoV-2 (targeting E, N, or RdRp genes).
- Cell culture: Vero E6 cells (or Vero E6/TMPRSS2) maintained in DMEM + 10% FBS.
- Biosafety Level 3 (BSL-3) facility.
Procedure:
- Specimen Processing: Vortex the VTM sample vigorously for 10-15 seconds.
- Ag-RDT Testing: Immediately perform the Ag-RDT according to the manufacturer's instructions using the required volume of VTM. Record the result and, if possible, the test line intensity.
- qRT-PCR Testing: Extract RNA from an aliquot (e.g., 140 µL) of the same VTM. Perform qRT-PCR in duplicate. Record the Ct value(s).
- Virus Culture Inoculation: a. Prepare a 24-well plate with confluent Vero E6 monolayers. b. Dilute 100-200 µL of the original VTM specimen in maintenance medium (DMEM + 2% FBS). Filter (0.45 µm) if concerned about bacterial contamination. c. Aspirate medium from cells and inoculate duplicate wells with the diluted specimen. d. Incubate at 37°C, 5% CO₂ for 1 hour for adsorption. e. Add fresh maintenance medium and incubate for up to 7 days.
- Culture Observation & Passaging: Observe daily for cytopathic effect (CPE). If CPE appears, harvest supernatant for PCR confirmation. If no CPE by day 7, perform a blind passage by inoculating fresh cells with supernatant from the first passage. Observe for another 7 days.
- Culture Positivity Definition: A sample is considered culture-positive if typical SARS-CoV-2 CPE (rounded, detached cells) is observed and confirmed by PCR.
Protocol 2: Quantifying the Relationship Between Ct Value, Antigen Concentration, and Culture
Based on methodologies from Pickering et al. and Miyakawa et al.
Objective: To model the probability of culture positivity based on Ag-RDT result or PCR Ct value.
Materials:
- Banked clinical samples with a range of PCR Ct values (e.g., 15-35).
- Ag-RDT kits.
- Cell culture system as in Protocol 1.
- Statistical software (R, GraphPad Prism).
Procedure:
- Sample Selection & Stratification: Select a panel of banked samples stratified by Ct value (e.g., 15-20, 20-25, 25-30, >30).
- Parallel Testing: Test each sample with Ag-RDT and viral culture (as in Protocol 1).
- Data Logging: For each sample, record: Ct value, Ag-RDT result (positive/negative), Ag-RDT line intensity (optional), and culture outcome (positive/negative).
- Statistical Analysis: a. Calculate the proportion of culture-positive samples for each Ct value bin and for Ag-RDT positive/negative groups. b. Fit a logistic regression model with culture outcome as the dependent variable and Ct value as the independent variable. Determine the Ct value at which the probability of positive culture drops below 5% or 50%. c. Calculate the sensitivity, specificity, positive predictive value (PPV), and negative predictive value (NPV) of Ag-RDT using culture as the reference standard.
Visualizations
The Scientist's Toolkit: Research Reagent Solutions
Table 2: Essential Materials for Ag-RDT/Culture Correlation Studies
| Item | Function/Justification | Example(s) |
|---|---|---|
| Vero E6 Cells | Standard mammalian cell line highly permissive to SARS-CoV-2 infection, essential for virus isolation and culture. | ATCC CRL-1586 |
| Vero E6/TMPRSS2 Cells | Engineered to express the TMPRSS2 protease, enhancing SARS-CoV-2 entry and improving culture sensitivity, especially for variants. | JCRB Cell Bank #1819 |
| Viral Transport Medium (VTM) | Preserves virus viability during specimen transport and storage prior to culture inoculation. | COPAN UTM, BD Universal Viral Transport Medium |
| SARS-CoV-2 Ag-RDT Kits | The diagnostic devices under evaluation. Must be used within their authorization and with appropriate sample types. | Abbott Panbio, SD Biosensor STANDARD Q, Roche SARS-CoV-2 Antigen |
| qRT-PCR Assay Kits | Gold standard for quantifying viral RNA load (Ct value), the primary comparator metric. | CDC 2019-nCoV RT-PCR, ThermoFisher TaqPath COVID-19 CE-IVD |
| Cell Culture Media | Supports growth and maintenance of host cells for the culture assay. | DMEM or MEM with 2-10% Fetal Bovine Serum (FBS) |
| BSL-3 Laboratory | Mandatory physical containment for working with live, cultured SARS-CoV-2 virus. | N/A - Facility requirement |
| Statistical Software | For robust analysis of correlation, sensitivity/specificity, and logistic regression modeling. | R, GraphPad Prism, SAS |
Conducting Robust Correlation Studies: Protocols and Best Practices
Sample Collection and Handling for Paired Ag-RDT and Culture Testing
1. Introduction and Context Within the broader thesis investigating the correlation between SARS-CoV-2 Antigen Rapid Diagnostic Test (Ag-RDT) results and cell culture infectivity, rigorous sample collection and handling is the foundational critical step. This protocol details the standardized procedures for obtaining and processing paired samples to ensure valid comparative data for downstream virological and diagnostic research.
2. Research Reagent Solutions and Materials Table 1: Essential Materials and Their Functions
| Material/Reagent | Primary Function in Protocol |
|---|---|
| Synthetic Flocked Nasopharyngeal (NP) Swabs | Optimized sample collection from the nasopharynx for maximal cellular and viral material recovery. |
| Viral Transport Media (VTM) | Stabilizes viral integrity and maintains cell viability for culture. Must be validated for cell culture compatibility. |
| Phosphate-Buffered Saline (PBS) | Provides an isotonic solution for sample dilution and processing without disrupting viral particles. |
| Ag-RDT Test Kits (e.g., Lateral Flow) | For rapid, on-site detection of SARS-CoV-2 nucleocapsid protein. |
| Vero E6 or Calu-3 Cell Lines | Permissive cell lines for SARS-CoV-2 isolation and culture. |
| Cell Culture Medium (DMEM) | Supports the growth and maintenance of the cell monolayer for infection. |
| Antibiotic-Antimycotic Solution | Prevents bacterial and fungal contamination in culture inoculates. |
| Cryopreservation Medium (e.g., with DMSO) | For long-term storage of primary sample aliquots at ultra-low temperatures. |
| Biosafety Cabinet (Class II) | Provides a sterile, contained environment for all sample handling to ensure operator safety and prevent contamination. |
3. Detailed Sample Collection Protocol Procedure for Paired Sample Acquisition:
- Swab Insertion: Gently insert a single flocked NP swab along the nasal septum to the nasopharynx until resistance is met.
- Sample Collection: Rotate the swab firmly against the nasopharyngeal wall for 5-10 seconds to absorb secretions.
- Paired Aliquot Creation:
- Aliquot for Ag-RDT: Immediately place the swab into a pre-labeled tube containing 1-3 mL of PBS or the specific buffer provided with the Ag-RDT kit. Vortex vigorously for 10-15 seconds. Use this eluate for the immediate Ag-RDT as per manufacturer instructions.
- Aliquot for Culture: Using a second, identical swab from the same subject collected in immediate succession, place it into a tube containing 3 mL of validated Viral Transport Media (VTM). Snap the swab shaft at the score line. This is the primary sample for culture.
- Storage & Transport: Keep samples at 2-8°C and process for culture inoculation within 48 hours. For longer delays, store at ≤ -70°C. Avoid repeated freeze-thaw cycles.
4. Experimental Protocol for Parallel Testing
4.1. Ag-RDT Execution
- Allow the Ag-RDT kit and the PBS/swab eluate sample to equilibrate to room temperature (15-30°C).
- Following the specific manufacturer's Instructions for Use (IFU), apply the exact volume of eluate to the sample well of the test device.
- Start a timer and read the result strictly at the recommended time (e.g., 15-30 minutes). Do not interpret results outside this window.
- Record the result (Positive/Negative/Invalid) and take a high-resolution photograph for documentation.
4.2. Cell Culture Inoculation for Virus Isolation
- Cell Preparation: Ensure Vero E6 cells are 80-90% confluent in a T-25 flask or 24-well plate.
- Sample Pre-treatment: Thaw the VTM sample if frozen. Vortex and centrifuge briefly to pellet debris.
- Inoculation: In a Biosafety Cabinet, aspirate growth medium from cells. Inoculate 200-500 µL of the VTM sample onto the cell monolayer. Include positive (known SARS-CoV-2 isolate) and negative (VTM only) controls.
- Adsorption: Incubate at 37°C, 5% CO2 for 1-2 hours, rocking every 15 minutes.
- Maintenance: After adsorption, remove the inoculum, wash cells with PBS, and add maintenance medium (e.g., DMEM + 2% FBS + Antibiotic-Antimycotic).
- Observation & Harvest: Monitor cells daily for Cytopathic Effect (CPE) for up to 7 days. Perform blind passage if no CPE is observed. Harvest supernatant upon significant CPE for viral titer determination (e.g., TCID50).
5. Data Integration and Analysis Table 2: Example Data Structure for Paired Results Analysis
| Sample ID | Ag-RDT Result (Visual) | Ct Value (RT-PCR) | Culture Outcome (CPE) | TCID50/mL (Titer) | Days to CPE Observation |
|---|---|---|---|---|---|
| P-001 | Positive | 22.5 | Positive | 10^5.2 | 3 |
| P-002 | Positive | 28.7 | Negative | N/A | N/A |
| P-003 | Negative | 35.0 | Negative | N/A | N/A |
| P-004 | Negative | Undetected | Negative | N/A | N/A |
6. Workflow and Pathway Visualizations
Diagram 1: Paired Testing Workflow (97 chars)
Diagram 2: Ag-RDT Signal Pathway (70 chars)
Standardized Cell Culture Protocols for SARS-CoV-2 (Vero E6/TMPRSS2)
1. Introduction and Application Context Within the broader thesis research on SARS-CoV-2 Antigen Rapid Diagnostic Test (Ag-RDT) and cell culture correlation testing, the use of standardized in vitro models is paramount. The Vero E6 cell line engineered to stably express the human transmembrane protease, serine 2 (TMPRSS2) is a critical tool. This cell line supports robust SARS-CoV-2 replication due to the presence of TMPRSS2, which facilitates viral entry via spike protein priming, bypassing endosomal pathways. These protocols detail the maintenance of Vero E6/TMPRSS2 cells, viral stock preparation, and infection procedures for quantifying infectious virus titers—a gold standard against which Ag-RDT clinical performance is correlated.
2. Key Research Reagent Solutions Table 1: Essential Materials for SARS-CoV-2 Culture in Vero E6/TMPRSS2 Cells
| Reagent/Material | Function/Explanation |
|---|---|
| Vero E6/TMPRSS2 Cells | African green monkey kidney epithelial cell line stably expressing human TMPRSS2, providing high ACE2 and protease expression for efficient SARS-CoV-2 entry and replication. |
| Dulbecco’s Modified Eagle Medium (DMEM) | Standard culture medium, supplemented as below, for cell growth and maintenance. |
| Fetal Bovine Serum (FBS) | Provides essential growth factors, hormones, and nutrients for cell proliferation. Typically used at 10% for growth, 2% for infection/maintenance. |
| MEM Non-Essential Amino Acids (NEAA) | Supplements medium with amino acids to improve cell viability and growth. |
| Sodium Pyruvate | Provides an additional energy source for cells. |
| Penicillin-Streptomycin (Pen-Strep) | Antibiotic mixture to prevent bacterial contamination in cell cultures. |
| Trypsin-EDTA (0.25%) | Proteolytic enzyme solution for detaching adherent cells from culture vessels for passaging. |
| SARS-CoV-2 Viral Isolate | Patient-derived or reference strain (e.g., USA-WA1/2020, Omicron BA.5) for infection experiments. Must be handled in BSL-3 containment. |
| Avicel RC-591 or Carboxymethylcellulose | Overlay medium component for plaque assays, forming a viscous gel to limit viral diffusion and enable plaque formation. |
| Neutral Red or Crystal Violet | Stains for plaque assay visualization; stains living cells or fixed monolayers, respectively, leaving clear plaques. |
| Tris-Buffered Saline (TBS) | Used for washing steps in plaque assay protocol. |
3. Detailed Experimental Protocols
Protocol 3.1: Maintenance and Subculturing of Vero E6/TMPRSS2 Cells Objective: To maintain healthy, proliferative cell stocks for infection experiments. Materials: Complete Growth Medium (DMEM + 10% FBS + 1x NEAA + 1 mM Sodium Pyruvate + 1% Pen-Strep), Trypsin-EDTA, T75 culture flasks, phosphate-buffered saline (PBS). Procedure:
- Aspirate spent medium from a confluent (~80-90%) T75 flask.
- Rinse cell monolayer gently with 5 mL PBS to remove residual serum.
- Add 2 mL of Trypsin-EDTA and incubate at 37°C for 3-5 minutes.
- Tap flask firmly to dislodge cells and observe under a microscope.
- Neutralize trypsin by adding 6 mL of Complete Growth Medium.
- Transfer cell suspension to a centrifuge tube and spin at 300 x g for 5 minutes.
- Aspirate supernatant and resuspend pellet in fresh medium.
- Seed new flasks at a 1:5 to 1:10 split ratio (e.g., 1-2 x 10^6 cells per T75).
- Incubate at 37°C with 5% CO₂. Refresh medium every 2-3 days.
Protocol 3.2: SARS-CoV-2 Infection for Virus Stock Preparation (Multiplicity of Infection - MOI based) Objective: To generate high-titer viral stocks for use in downstream assays. Materials: Vero E6/TMPRSS2 cells at 90% confluence, Infection Medium (DMEM + 2% FBS + 1x NEAA + 1 mM Sodium Pyruvate), SARS-CoV-2 seed stock, PBS. Procedure (BSL-3):
- Aspirate growth medium from cell monolayer (e.g., in T175 flask).
- Wash cells once with PBS.
- Dilute SARS-CoV-2 seed stock in pre-warmed Infection Medium to achieve an MOI of 0.01.
- Add the inoculum to the flask (e.g., 5 mL for T175) and incubate at 37°C, 5% CO₂ for 1 hour, rocking every 15 minutes.
- After adsorption, remove inoculum and add 20 mL of fresh Infection Medium.
- Incubate for 48-72 hours, monitoring for extensive cytopathic effect (CPE; >80% cell rounding and detachment).
- Harvest supernatant by centrifugation at 2,000 x g for 10 minutes at 4°C to remove cellular debris.
- Aliquot clarified supernatant and store at -80°C.
Protocol 3.3: Plaque Assay for SARS-CoV-2 Titer Determination Objective: To quantify infectious virus titer in Plaque-Forming Units per mL (PFU/mL). Materials: 12-well or 24-well plates, Vero E6/TMPRSS2 cells (seeded to 100% confluence), Avicel overlay (2% in 2X DMEM, mixed 1:1 with 2X Infection Medium), 10% Formalin, 0.1% Crystal Violet solution. Procedure (BSL-3):
- Prepare 10-fold serial dilutions of viral sample in Infection Medium (10^-1 to 10^-8).
- Aspirate medium from confluent cell monolayers in a multi-well plate.
- Inoculate wells with 100-300 µL of each viral dilution in duplicate. Include mock-infected controls.
- Incubate for 1 hour at 37°C, rocking every 15 minutes.
- Remove inoculum and carefully overlay each well with 1-2 mL of pre-warmed Avicel overlay medium.
- Incubate for 72 hours at 37°C, 5% CO₂.
- Carefully aspirate overlay and fix cells with 10% formalin for 1 hour at room temperature (or overnight at 4°C).
- Remove formalin and stain cells with 0.1% Crystal Violet for 20 minutes.
- Rinse plates gently with tap water. Count distinct, clear plaques.
- Calculate titer: PFU/mL = (Average plaque count) / (Dilution factor x Inoculum volume in mL).
Table 2: Typical Viral Titers and Timeline
| Process | Input (MOI or Seed) | Incubation Time | Expected Output Titer (PFU/mL)* | Key Readout |
|---|---|---|---|---|
| Stock Preparation | MOI = 0.01 | 48-72 h | 1 x 10^6 to 1 x 10^7 | Extensive CPE |
| Plaque Assay | 10-100 PFU/well | 72 h (post-overlay) | N/A (Quantitative) | Discrete Plaques |
*Titer is strain-dependent and can vary.
4. Visualized Workflows and Pathways
Diagram 1: Viral Stock Generation Workflow (62 chars)
Diagram 2: Plaque Assay Protocol for Titer Determination (74 chars)
Diagram 3: Viral Entry via ACE2 & TMPRSS2 Pathway (53 chars)
Within SARS-CoV-2 Ag-RDT and cell culture correlation research, establishing robust quantitative relationships between molecular, antigenic, and infectivity metrics is paramount. This application note details the frameworks linking RT-qPCR Cycle Threshold (Ct) values, viral antigen concentration, and the 50% Tissue Culture Infectious Dose (TCID50), crucial for assay calibration, therapeutic efficacy studies, and public health guidance.
Table 1: Correlation Benchmarks Between Ct, Antigen, and TCID50 for SARS-CoV-2 (Wild-Type)
| Metric | Typical Range | Approx. Correlation to TCID50/mL (Log10) | Key Assay/Platform | Primary Research Utility |
|---|---|---|---|---|
| RT-qPCR Ct (E gene) | 10-35 | Ct 10 ≈ 8.0; Ct 20 ≈ 6.0; Ct 30 ≈ 4.0; Ct 35 ≈ 2.0* | CDC N1, RdRp assays | Viral load quantification; infectiousness risk proxy. |
| Nucleocapsid Antigen (pg/mL) | 10^2 - 10^6 | 1.0 log10 TCID50 ≈ 2.5-3.5 log10 pg/mL* | Lumit, ELISA, MSD | Ag-RDT limit of detection modeling; viral particle estimation. |
| TCID50/mL (Log10) | 1.0 - 8.0 | Gold Standard | Vero E6 / TMPRSS2 cells | Definitive infectivity titer; neutralization assay input. |
Note: Correlations are strain- and assay-dependent. These are generalized estimates from current literature. Direct experimental calibration is essential.
Table 2: Implied Detection Limits of Common Ag-RDTs
| Ag-RDT Sensitivity Context | Equivalent Approx. Ct Range | Equivalent Approx. TCID50/mL (Log10) | Interpretation |
|---|---|---|---|
| High-Sensitivity RDT (≥95% at Ct<25) | ≤25 | ≥5.0 | Likely detects culture-positive, infectious samples. |
| Moderate-Sensitivity RDT (≥80% at Ct<30) | 25-30 | 3.0 - 5.0 | Variable detection in samples with lower infectivity. |
| Lower-Sensitivity RDT | >30 | <3.0 | May miss samples with low-level infectivity. |
Experimental Protocols
Protocol 1: Establishing a Standard Curve for Ct vs. TCID50
Objective: To generate a laboratory-specific quantitative model linking RT-qPCR results to infectious titer.
Materials:
- SARS-CoV-2 virus stock (titered).
- Vero E6 or Vero E6/TMPRSS2 cells.
- Appropriate cell culture media and plastics.
- RNA extraction kit.
- RT-qPCR master mix and validated primer/probe set (e.g., N1, E).
- Serial dilution tubes.
Methodology:
- Virus Serial Dilution: Perform a 10-fold serial dilution of the virus stock in infection media across at least 8 logs.
- TCID50 Assay: In a 96-well plate, seed 100 µL of cell suspension (2-3 x 10^4 cells/well). The next day, inoculate 8 wells per dilution with 100 µL of each virus dilution. Include cell controls. Incubate for 3-5 days.
- Cytopathic Effect (CPE) Scoring: Score each well for CPE. Calculate TCID50/mL using the Spearman-Kärber or Reed & Muench method.
- Parallel RNA Extraction & RT-qPCR: From the same dilution series used in step 2, take an aliquot (e.g., 100 µL) for RNA extraction and RT-qPCR in duplicate/triplicate. Record Ct values.
- Data Analysis: Plot Log10(TCID50/mL) against mean Ct value for each positive dilution. Perform linear regression analysis to derive the equation: Log10(TCID50) = m(Ct) + b.
Protocol 2: Correlating Antigen Concentration with Infectivity
Objective: To quantify viral nucleocapsid (N) antigen and correlate with TCID50.
Materials:
- SARS-CoV-2 clinical isolates or culture supernatants.
- Quantitative N Protein ELISA or MSD/U-PLEX assay.
- TCID50 assay materials (as in Protocol 1).
- Sample dilution buffer.
Methodology:
- Sample Preparation: Use a panel of virus culture supernatants or inactivated clinical samples with a known range of infectivity.
- Determine Infectivity: Perform TCID50 assay on an aliquot of each sample as in Protocol 1.
- Quantify Antigen: In parallel, dilute samples appropriately to fit within the dynamic range of the antigen assay. Perform the quantitative immunoassay according to manufacturer's instructions, using a purified N protein standard curve.
- Correlation Analysis: Plot Log10(TCID50/mL) against Log10(Antigen Concentration, pg/mL). Perform regression analysis. This curve informs the antigen level corresponding to a given infectious titer.
Protocol 3: Evaluating Ag-RDT Performance Against Quantitative Frameworks
Objective: To determine the detection probability of an Ag-RDT across Ct and TCID50 values.
Materials:
- Panel of characterized samples (Ct, TCID50, antigen quantified).
- Target Ag-RDT kits.
- Timer.
Methodology:
- Blinded Testing: Code the characterized sample panel. Perform the Ag-RDT strictly per manufacturer's instructions by a blinded operator.
- Result Recording: Record visual result (positive/negative) and any reader output.
- Logistic Regression Analysis: For each sample, plot Ag-RDT result (0/1) against (a) Ct value and (b) Log10(TCID50). Fit a logistic curve to determine the Ct50 and TCID50_50 (the point of 50% detection probability). This defines the clinical sensitivity relative to infectivity.
The Scientist's Toolkit: Key Research Reagent Solutions
Table 3: Essential Materials for Correlation Studies
| Item | Function & Relevance | Example/Note |
|---|---|---|
| Vero E6/TMPRSS2 Cells | Permissive cell line for SARS-CoV-2 isolation and TCID50. Ensures high viral entry efficiency. | ATCC CRL-1586, engineered to stably express TMPRSS2. |
| Quantitative RT-qPCR Assay | Gold standard for viral RNA quantification. Provides Ct values. | CDC 2019-nCoV_N1, Charité E gene assay. Must include standard curve. |
| Recombinant SARS-CoV-2 N Protein | Critical standard for calibrating antigen detection assays. | Full-length, purified protein for ELISA/ MSD standard curves. |
| Plaque or TCID50 Reference Standard | Harmonizes infectivity titers across experiments and labs. | WHO International Standard for SARS-CoV-2 (NIBSC code: 20/146). |
| Virus Inactivation Buffer | Safely inactivates virus for downstream antigen or RNA testing without significantly affecting targets. | Buffers containing TRIzol, detergent (e.g., 1% Triton X-100), or proprietary formulas. |
| Multiplex Electrochemiluminescence (MSD) Assay | Allows simultaneous, quantitative measurement of multiple antigens (e.g., N, S) with wide dynamic range. | MSD U-PLEX SARS-CoV-2 panels. |
| Digital PCR (dPCR) System | Provides absolute quantification of viral RNA copies without a standard curve, strengthening Ct interpretation. | Droplet Digital PCR (ddPCR) with SARS-CoV-2 target assays. |
Visualized Workflows & Relationships
Title: Quantitative Framework Integration Workflow
Title: Parameter Correlation & Ag-RDT Detection Gradient
Statistical Methods for Determining Sensitivity, Specificity, and Positive Predictive Value (PPV)
Application Notes and Protocols
Within the context of SARS-CoV-2 antigen rapid diagnostic test (Ag-RDT) validation against the gold standard of cell culture-based virus isolation, robust statistical evaluation of diagnostic accuracy is paramount. This protocol details the methodologies for determining sensitivity, specificity, and PPV, which are critical for assessing clinical and public health utility in drug and diagnostic development pipelines.
1. Foundational Definitions and 2x2 Contingency Table
The core calculations are derived from a 2x2 table comparing the index test (Ag-RDT) results against the reference standard (cell culture).
Table 1: 2x2 Contingency Table for Diagnostic Test Evaluation
| Reference Standard Positive (Cell Culture +) | Reference Standard Negative (Cell Culture -) | Total | |
|---|---|---|---|
| Index Test Positive (Ag-RDT +) | True Positive (a) | False Positive (b) | a + b |
| Index Test Negative (Ag-RDT -) | False Negative (c) | True Negative (d) | c + d |
| Total | a + c | b + d | N |
2. Core Statistical Formulas and Protocol
Protocol 2.1: Calculation of Key Metrics
- Objective: To compute Sensitivity, Specificity, PPV, and Negative Predictive Value (NPV).
- Materials: Completed 2x2 table with validated cell culture and Ag-RDT results.
- Procedure:
- Sensitivity (True Positive Rate): Calculate the proportion of truly infected individuals (cell culture +) correctly identified by the Ag-RDT.
- Formula: ( \text{Sensitivity} = \frac{a}{(a + c)} )
- Specificity (True Negative Rate): Calculate the proportion of truly uninfected individuals (cell culture -) correctly identified by the Ag-RDT.
- Formula: ( \text{Specificity} = \frac{d}{(b + d)} )
- Positive Predictive Value (PPV): Calculate the probability that a positive Ag-RDT result truly indicates infection (cell culture +).
- Formula: ( \text{PPV} = \frac{a}{(a + b)} )
- Negative Predictive Value (NPV): Calculate the probability that a negative Ag-RDT result truly indicates no infection (cell culture -).
- Formula: ( \text{NPV} = \frac{d}{(c + d)} )
- Sensitivity (True Positive Rate): Calculate the proportion of truly infected individuals (cell culture +) correctly identified by the Ag-RDT.
- Output: Express each metric as a percentage (95% Confidence Interval recommended).
Table 2: Example Calculation from a Hypothetical SARS-CoV-2 Ag-RDT Study (N=500)
| Metric | Calculation | Result | 95% CI (Wilson Score) |
|---|---|---|---|
| Sensitivity | 85 / (85 + 15) | 85.0% | 76.4% - 91.0% |
| Specificity | 392 / (392 + 8) | 98.0% | 96.2% - 99.0% |
| PPV | 85 / (85 + 8) | 91.4% | 83.9% - 95.6% |
| NPV | 392 / (392 + 15) | 96.3% | 94.0% - 97.8% |
Legend: a=85, b=8, c=15, d=392.
3. Advanced Considerations & Protocol for Confidence Intervals
Protocol 3.1: Calculating 95% Confidence Intervals (Wilson Score Method)
- Objective: To account for sampling variability in point estimates.
- Rationale: The Wilson score interval performs well for proportions, especially near 0 or 1 and with small samples.
- Procedure: For a proportion ( p = a/n ), where ( n ) is the relevant denominator (e.g., a+c for sensitivity):
- Use the formula: ( \frac{1}{1+z^2/n}\left[ p + \frac{z^2}{2n} \pm z \sqrt{\frac{p(1-p)}{n} + \frac{z^2}{4n^2}} \right] )
- For a 95% CI, the z-value is 1.96.
- Utilize statistical software (R, Stata, SAS, online calculators) to perform this calculation for each metric.
4. Impact of Disease Prevalence on PPV
Protocol 4.1: Modeling PPV Across Prevalence Scenarios
- Objective: To illustrate how PPV, a critical metric for interpreting positive results in the field, varies with underlying disease prevalence.
- Procedure:
- Using the Ag-RDT's fixed sensitivity (Se) and specificity (Sp) from your validation study.
- Apply Bayes' Theorem: ( \text{PPV} = \frac{ \text{Prevalence} \times \text{Se} }{ (\text{Prevalence} \times \text{Se}) + ((1-\text{Prevalence}) \times (1-\text{Sp})) } )
- Calculate PPV for a range of prevalence values (e.g., 1%, 5%, 10%, 20%).
- Output: A table or graph demonstrating the direct relationship between prevalence and PPV.
Table 3: PPV Modeling at Fixed Sensitivity (85%) and Specificity (98%)
| Assumed Prevalence | PPV Calculation | Modeled PPV |
|---|---|---|
| 1% (Low Community Spread) | (0.010.85) / ((0.010.85)+(0.99*0.02)) | 30.1% |
| 10% (Moderate Outbreak) | (0.100.85) / ((0.100.85)+(0.90*0.02)) | 82.5% |
| 20% (High Outbreak) | (0.200.85) / ((0.200.85)+(0.80*0.02)) | 91.4% |
The Scientist's Toolkit: Research Reagent Solutions for SARS-CoV-2 Ag-RDT/Culture Correlation
Table 4: Essential Materials for Validation Studies
| Item | Function in Validation Study |
|---|---|
| Vero E6/TMPRSS2 Cell Line | Permissive cell culture system for isolating and propagating infectious SARS-CoV-2. |
| Virus Transport Medium (VTM) | Preserves viral integrity of nasopharyngeal/oropharyngeal swab specimens during transport to the lab for culture. |
| SARS-CoV-2 Nucleocapsid (N) Protein Monoclonal Antibodies | Key capture/detection reagents in most Ag-RDTs; used also for orthogonal testing (e.g., ELISA). |
| qRT-PCR Assay (Targeting E, N, RdRp genes) | Provides cycle threshold (Ct) values as a semi-quantitative proxy for viral load, used to stratify sensitivity analysis. |
| Reference SARS-CoV-2 Strain (e.g., Delta, Omicron BA.5) | Used for controlled spiking studies to assess analytical sensitivity (Limit of Detection) in a defined matrix. |
| Pseudovirus Neutralization Assay System | To correlate Ag-RDT positivity with potential infectivity in a BSL-2 setting. |
Visualization: Diagnostic Test Evaluation Workflow
Title: Diagnostic Accuracy Study Statistical Workflow
Visualization: Relationship Between Prevalence, PPV, and NPV
Title: How Prevalence Affects Predictive Values
Application in Clinical Trial Settings and Therapeutic Drug Monitoring.
1. Introduction within the Broader Thesis Context This document outlines specific applications, protocols, and methodologies derived from a broader research thesis investigating the correlation between SARS-CoV-2 Antigen Rapid Diagnostic Test (Ag-RDT) results and viral culture infectivity. The core thesis posits that Ag-RDT signal intensity quantitatively correlates with cultivable virus titer, providing a surrogate marker for infectiousness. This relationship is leveraged here to inform two critical areas in pharmaceutical development: the screening and monitoring of participants in clinical trials for antiviral therapies, and the therapeutic drug monitoring (TDM) of such agents to optimize dosing and evaluate efficacy.
2. Application Note: Participant Screening & Monitoring in Antiviral Clinical Trials The rapid identification and enrollment of participants with active, potentially transmissible SARS-CoV-2 infection is crucial for antiviral trial integrity. Furthermore, monitoring viral clearance dynamics is a key efficacy endpoint.
- Rationale: Ag-RDTs offer point-of-care feasibility, but their binary result may be insufficient. Our correlation data enables the use of Ag-RDT quantitative signal (e.g., reader-reported optical density or test line intensity) as a proxy for baseline infectious viral load and its decay kinetics.
- Protocol AN-P-001: Quantitative Ag-RDT for Trial Enrollment & Longitudinal Sampling
- Sample Collection: At screening and each scheduled visit (e.g., Days 1, 3, 5, 7, 14), collect paired anterior nasal or nasopharyngeal swabs.
- Sample Processing: Immediately place one swab into the recommended viral transport medium (VTM).
- Ag-RDT Execution: Perform the approved Ag-RDT per manufacturer's instructions on the second swab (if direct application) or an aliquot of VTM.
- Signal Quantification: Use a calibrated lateral flow reader to obtain a continuous numerical value (e.g., relative light units - RLU) for the test line. Record visual result (positive/negative) and Ct value (if RT-PCR is run in parallel).
- Data Integration: Enter Ag-RDT quantitative value, time since symptom onset, and treatment arm into a pre-established regression model (derived from thesis correlation studies) to estimate the baseline and subsequent cultivable virus titer.
Table 1: Correlation of Ag-RDT Signal to Cultivable Virus Titer (Modeled Data from Thesis Research)
| Ag-RDT Signal Range (RLU) | Predicted Median TCID₅₀/mL (Log₁₀) | Culture Positivity Probability (%) | Proposed Clinical Trial Action |
|---|---|---|---|
| > 1,000,000 | ≥ 6.0 | > 99 | Confirm eligibility; High priority enrollment. |
| 100,000 - 1,000,000 | 4.5 - 5.9 | 85 - 98 | Eligible for enrollment. |
| 10,000 - 100,000 | 3.0 - 4.4 | 30 - 80 | Eligibility dependent on protocol-specified cutoff. |
| < 10,000 | < 3.0 | < 10 | Screen fail; unlikely to have culturable virus. |
3. Application Note: Therapeutic Drug Monitoring (TDM) via Surrogate Virologic Markers TDM for antivirals traditionally relies on pharmacokinetic (PK) measures. Integrating pharmacodynamic (PD) virologic markers enhances outcome prediction. The Ag-RDT/culture correlation allows Ag-RDT signal decay to serve as a rapid, functional PD marker of drug effect.
- Rationale: The rate of decline in cultivable virus is a direct measure of antiviral activity. Frequent virologic monitoring via culture is impractical. Quantitative Ag-RDT provides a feasible surrogate.
- Protocol AN-TDM-001: Ag-RDT Signal Kinetics as a PD Marker for TDM
- Baseline PK/PD Profile: Upon first dose, collect blood for PK analysis and a nasal swab for quantitative Ag-RDT (as per AN-P-001).
- Dense Longitudinal Sampling (Day 1-3): Perform quantitative Ag-RDT at 0h (pre-dose), 12h, 24h, 48h, and 72h post-first dose.
- Signal Decay Modeling: Plot Ag-RDT RLU (log-scale) against time. Calculate the slope of decay (λAg-RDT) over the first 72 hours.
- Integration with PK: Correlate individual patient PK parameters (e.g., AUC₀–₂₄, Cₜᵣₒᵤ𝑔ₕ) with λAg-RDT.
- Clinical Correlation: Determine the target λ_Ag-RDT associated with successful clinical outcome (e.g., sustained symptom resolution) from trial data. Use this to identify suboptimal responders who may benefit from dose adjustment.
Table 2: Example TDM Decision Matrix Based on Ag-RDT Signal Decay
| Ag-RDT Decay Rate (λ_Ag-RDT) log₁₀ RLU/day | Interpretation | Suggested TDM Action |
|---|---|---|
| < -0.7 | Rapid viral clearance. Optimal pharmacodynamic response. | Maintain current dose. |
| -0.3 to -0.7 | Moderate clearance. Adequate response. | Maintain dose; monitor for clinical progression. |
| > -0.3 | Slow clearance. Suboptimal pharmacodynamic response. | Check adherence & PK; consider dose escalation if tolerated. |
4. Detailed Experimental Protocols from Underlying Research
Protocol EXP-001: SARS-CoV-2 Cell Culture for TCID₅₀ Determination
- Objective: To quantify infectious virus titer in clinical specimens.
- Materials: Vero E6 or Vero E6-TMPRSS2 cells, Dulbecco's Modified Eagle Medium (DMEM) with 2-10% FBS, penicillin-streptomycin, 96-well tissue culture plates, clinical specimen in VTM.
- Methodology:
- Seed 96-well plates with Vero E6 cells at 2x10⁴ cells/well and incubate at 37°C, 5% CO₂ for 24h.
- Serially dilute the clinical specimen (in VTM) 10-fold (10⁻¹ to 10⁻⁶) in infection medium (DMEM, 2% FBS, antibiotics).
- Aspirate media from the cell plate. Infect 8 wells per dilution with 100µL of diluted inoculum. Include cell-only controls.
- Incubate for 1 hour at 37°C, rocking every 15 minutes.
- Aspirate inoculum, add 150µL of maintenance medium (DMEM, 2% FBS) per well.
- Incubate at 37°C, 5% CO₂ for 5-7 days.
- Score wells for cytopathic effect (CPE) under a microscope.
- Calculate TCID₅₀/mL using the Reed-Muench or Spearman-Kärber method.
Protocol EXP-002: Quantitative Ag-RDT Analysis
- Objective: To obtain a continuous quantitative signal from a lateral flow Ag-RDT.
- Materials: Commercial SARS-CoV-2 Ag-RDT kit, calibrated lateral flow reader (e.g., ESEQuant LR3, QDX Reader), timer.
- Methodology:
- Perform the Ag-RDT strictly according to the manufacturer's IFU using the clinical specimen.
- At the exact end of the recommended development time, insert the test cassette into the reader.
- Using the instrument's software, quantify the test (T) and control (C) line intensities in pre-defined relative units (RLU, AU).
- Export the T/C ratio or raw T-line value for analysis. Do not rely solely on visual interpretation.
5. The Scientist's Toolkit: Research Reagent Solutions
Table 3: Essential Materials for Ag-RDT/Culture Correlation Studies
| Item | Function & Relevance |
|---|---|
| Vero E6-TMPRSS2 Cells | Cell line highly permissive to SARS-CoV-2 infection, essential for virus culture. |
| Viral Transport Medium | Preserves virus viability during specimen transport and storage. |
| Calibrated LFD Reader | Provides objective, quantitative data from Ag-RDT strips, enabling correlation analysis. |
| SARS-CoV-2 Ag-RDT Kits | The diagnostic tool being validated against the gold standard of culture. |
| qRT-PCR Assay Kits | Provides the standard molecular Ct value for parallel comparison with Ag-RDT and culture. |
| Microplate Scanner/Imager | Allows for automated imaging and analysis of cell culture plates for CPE quantification. |
6. Visualizations
Ag-RDT and Culture Correlation Workflow
TDM Decision Pathway Integrating PK and Ag-RDT PD
Resolving Discrepancies and Enhancing Assay Predictive Power
Application Notes and Protocols
1.0 Thesis Context This document details critical methodological considerations for research investigating the correlation between SARS-CoV-2 Antigen Rapid Diagnostic Test (Ag-RDT) results and cell culture-based infectivity assays. Accurate correlation is paramount for defining the clinical and public health significance of Ag-RDT positivity. Sample integrity from collection to analysis is the foundational variable most frequently compromising this correlation.
2.0 Pitfall Analysis and Quantitative Data Summary
Table 1: Impact of Common Sample Pitfalls on SARS-CoV-2 Assay Outcomes
| Pitfall Category | Specific Issue | Impact on Viral Antigen (Ag-RDT) | Impact on Viral RNA (RT-qPCR) | Impact on Infectivity (Cell Culture) |
|---|---|---|---|---|
| Sample Integrity | Prolonged storage at room temp (>4h) | Moderate-High Degradation (Protein denaturation) | Low Degradation (Stable in inactivating media) | High Loss (Viral inactivation) |
| Transport Media | Use of PCR-only media (e.g., Guanidinium) | Complete Detection Failure (Antigen lysis/dilution) | Optimal Preservation | Complete Loss (Viral lysis) |
| Freeze-Thaw Cycles | 1 cycle (from -80°C) | Variable (10-30% signal loss) | Minimal (<1 Ct shift) | Significant Loss (20-50% TCID₅₀) |
| Freeze-Thaw Cycles | ≥2 cycles | High Loss (>50% signal loss) | Moderate (1-2 Ct shift) | Severe Loss (>80% TCID₅₀) |
3.0 Detailed Experimental Protocols
Protocol 3.1: Standardized Nasopharyngeal Swab Processing for Correlation Studies Purpose: To uniformly process swabs for parallel Ag-RDT, RT-qPCR, and cell culture assay. Reagents: Viral Transport Media (VTM) with protein stabilizers (e.g., gelatin, bovine serum albumin), Universal Transport Media (UTM), PBS (for specific Ag-RDTs). Procedure:
- Collection: Collect NP swab per WHO guidelines.
- Elution: Immediately place swab into 3mL of approved transport media. Vortex vigorously for 10-15 seconds.
- Aliquoting (CRITICAL STEP): Within 15 minutes of collection, aliquot eluate into three sterile, labeled tubes:
- Aliquot A (Ag-RDT): 100-150 µL (use immediately or freeze at -80°C once).
- Aliquot B (RNA/RT-qPCR): 500 µL (store at 4°C if extracting within 72h, else -80°C).
- Aliquot C (Cell Culture): 1 mL (process immediately for inoculation. Do not freeze for culture).
- Documentation: Record time of collection, time of aliquoting, and media type.
Protocol 3.2: Systematic Freeze-Thaw Cycle Experiment Purpose: To quantify the impact of freeze-thaw cycles on SARS-CoV-2 nucleocapsid antigen, RNA, and infectious titer. Reagents: Cultured SARS-CoV-2 isolate (alpha variant, titrated), VTM, specific Ag-RDT kit, RNA extraction kit, qPCR master mix, Vero E6/TMPRSS2 cells. Procedure:
- Sample Preparation: Spike SARS-CoV-2 into VTM to a target concentration (~100x LoD of Ag-RDT). Create a master mix and aliquot 200µL into 10 identical cryovials.
- Baseline Testing: Process one aliquot immediately for Ag-RDT (in triplicate), RNA extraction/qPCR (N1 gene), and TCID₅₀ assay on Vero E6 cells.
- Freeze-Thaw Cycling: Subject remaining aliquots to defined cycles. One cycle = freezing at -80°C for 24h, then thawing at room temperature until just ice-free, then vortexing.
- Testing: After 1, 2, and 3 cycles, remove corresponding vials and repeat the tripartite testing (Ag-RDT, RT-qPCR, TCID₅₀).
- Analysis: Express Ag-RDT signal intensity (if quantitative), PCR Ct values, and TCID₅₀/mL as percentage loss relative to baseline (Cycle 0).
4.0 Visualizations
Diagram 1: Sample Journey & Assay Correlation Workflow
Diagram 2: Freeze-Thaw Impact on Viral Components
5.0 The Scientist's Toolkit: Essential Research Reagents & Materials
Table 2: Key Reagent Solutions for Correlation Research
| Item | Function & Rationale |
|---|---|
| Viral Transport Media (VTM) with Protein Stabilizers | Preserves protein antigen integrity for Ag-RDT and maintains virion viability for culture. Contains antibiotics/antimycotics and protein (e.g., BSA, gelatin). |
| Universal Transport Media (UTM) | Similar to VTM, optimized for both molecular and culture work. The recommended standard for correlation studies. |
| SARS-CoV-2 Nucleocapsid Protein (Recombinant) | Positive control for Ag-RDT assay optimization and standard curve generation in quantitative tests. |
| Vero E6 / TMPRSS2 Cell Line | Standard cell line for SARS-CoV-2 isolation and TCID₅₀/plaque assays due to high ACE2 and TMPRSS2 expression. |
| Target-Specific qPCR Assay (e.g., CDC N1) | Gold-standard RNA detection for quantifying viral load. Used as a comparator, not a direct correlate of infectivity. |
| Protease Inhibitor Cocktail | Optional additive to VTM for samples destined for Ag-RDT after storage, to minimize antigen degradation. |
| Cryopreservation Media (e.g., with DMSO) | For stabilizing cell lines long-term, ensuring consistent culture assay performance. |
| Validated SARS-CoV-2 Ag-RDT Kit | Kit must be thoroughly validated for use with the chosen transport media. Some kits are only approved for direct swab or specific buffers. |
Application Notes: The Impact of Cell Line Selection on SARS-CoV-2 Isolation
Successful isolation and propagation of SARS-CoV-2 in cell culture are critical for research on viral pathogenicity, antiviral screening, and vaccine development. A significant challenge is the occurrence of "false-negative" cultures, where infectious virus is present in a clinical sample but fails to produce a cytopathic effect (CPE) or replicate to detectable levels in the chosen cell line. This failure is intrinsically linked to two interdependent factors: inherent cell line suitability and viral fitness, often driven by evolutionary selection pressure, notably from spike protein mutations.
Recent research underscores that the efficiency of viral isolation is highly dependent on the expression levels of host entry receptors (ACE2) and proteases (TMPRSS2), which can vary dramatically between cell lines. Furthermore, the emergence of variants with altered spike proteins has shifted the optimal cell line models. For instance, the Omicron variant and its sublineages exhibit a distinct cell tropism, often showing reduced replication in Vero E6 cells but enhanced replication in cell lines expressing high levels of TMPRSS2, like Caco-2 and Calu-3.
The correlation with SARS-CoV-2 Antigen Rapid Diagnostic Test (Ag-RDT) results adds another layer of complexity. A sample with a high viral load (low Ct value) that tests positive via Ag-RDT may still fail to culture if plated on a non-permissive cell line for that particular variant. Therefore, protocol standardization must account for variant-specific properties to minimize false-negative cultures and ensure reliable downstream research data.
Key Quantitative Findings on Cell Line Permissivity
The following table summarizes recent comparative data on the permissiveness of common cell lines to different SARS-CoV-2 variants, based on viral titer measurements and CPE observation.
Table 1: Comparative Susceptibility of Cell Lines to SARS-CoV-2 Variants
| Cell Line | Primary Tissue Origin | Key Receptors (ACE2/TMPRSS2) | Permissiveness to Ancestral/D614G | Permissiveness to Omicron (BA.1/BA.5) | Time to Observable CPE (Ancestral) | Notes |
|---|---|---|---|---|---|---|
| Vero E6 | African Green Monkey Kidney | ACE2 (high), TMPRSS2 (low) | High (Titer: ~10⁷ PFU/ml) | Moderate to Low (Titer: ~10⁵ PFU/ml) | 2-3 days | Standard workhorse; lacks IFN response; may select for spike mutations. |
| Vero E6/TMPRSS2 | Engineered Vero E6 | ACE2 (high), TMPRSS2 (high) | Very High (Titer: ~10⁸ PFU/ml) | High (Titer: ~10⁷ PFU/ml) | 1-2 days | Enhances entry for TMPRSS2-utilizing variants; reduces adaptation artifacts. |
| Calu-3 | Human Lung Adenocarcinoma | ACE2 (mod), TMPRSS2 (high) | High (Titer: ~10⁶ PFU/ml) | High (Titer: ~10⁶ PFU/ml) | 3-5 days | Physiologically relevant model for lung infection; slower CPE. |
| Caco-2 | Human Colorectal Adenocarcinoma | ACE2 (high), TMPRSS2 (high) | High (Titer: ~10⁶ PFU/ml) | Very High (Titer: ~10⁷ PFU/ml) | 3-4 days | Excellent for Omicron lineage isolation and propagation. |
| A549-ACE2 | Engineered Human Lung Carcinoma | ACE2 (engineered high), TMPRSS2 (low) | Moderate (Titer: ~10⁵ PFU/ml) | Low (Titer: ~10⁴ PFU/ml) | 4-7 days | Useful for entry studies; not optimal for primary isolation of Omicron. |
Detailed Protocols
Protocol 1: SARS-CoV-2 Virus Isolation from Clinical Specimens Using a Multi-Cell Line Approach
Objective: To maximize the probability of successful virus isolation from Ag-RDT-positive nasal/oropharyngeal swab samples by simultaneously inoculating complementary cell lines.
Materials:
- Clinical specimen in viral transport media (VTM).
- Confluent monolayers of Vero E6, Vero E6/TMPRSS2, and Caco-2 cells in T-25 flasks or 6-well plates.
- Dulbecco’s Modified Eagle Medium (DMEM) with 2% fetal bovine serum (FBS) and 1x Antibiotic-Antimycotic (infection media).
- Serum-free DMEM for dilution.
- Biological safety cabinet (BSC Level 2 or 3).
- Centrifuge.
- 0.22 µm syringe filters.
Procedure:
- Specimen Preparation: Thaw the VTM sample on ice. Centrifuge at 2000 x g for 10 minutes at 4°C to pellet debris. Filter the supernatant through a 0.22 µm syringe filter.
- Cell Preparation: Aspirate growth media from all cell lines. Wash cell monolayers once with 2 mL of sterile PBS.
- Inoculation: For each cell line, prepare an inoculation mix:
- Dilute 500 µL of filtered sample supernatant with 500 µL of serum-free DMEM.
- Aspirate PBS from the cell monolayer and add the 1 mL inoculum directly to the cells.
- Include a negative control (uninfected cells with infection media only).
- Adsorption: Incubate the inoculated cells at 37°C, 5% CO2 for 1-2 hours, gently rocking every 15 minutes.
- Post-Inoculation: After adsorption, aspirate the inoculum. Wash the monolayer gently with 2 mL PBS to remove unbound virus. Add 5 mL (for T-25) of pre-warmed infection media (DMEM + 2% FBS + Antibiotic-Antimycotic).
- Incubation & Monitoring: Incubate cells at 37°C, 5% CO2. Monitor daily for cytopathic effect (CPE: rounded, detached cells, syncytia) using an inverted light microscope.
- Harvesting: Harvest the culture supernatant when CPE reaches ~80% (typically 3-7 days). If no CPE is observed after 7 days, perform a blind passage: harvest supernatant, filter (0.22 µm), and inoculate onto fresh cells of the same line. Repeat for up to 3 passages.
- Titration: Determine the viral titer of harvested supernatant by plaque assay on Vero E6/TMPRSS2 cells.
Protocol 2: Assessing Viral Fitness via Plaque Assay Morphology on Engineered Cell Lines
Objective: To evaluate the replicative fitness and entry pathway preference of a SARS-CoV-2 isolate by comparing plaque phenotypes on Vero E6 vs. Vero E6/TMPRSS2 cells.
Materials:
- Virus isolate supernatant.
- Confluent monolayers of Vero E6 and Vero E6/TMPRSS2 cells in 12-well plates.
- Infection media (DMEM + 2% FBS).
- Overlay media: 1.5% carboxymethylcellulose (CMC) in infection media.
- Crystal Violet stain (0.2% in 10% ethanol).
Procedure:
- Cell Preparation: Seed cells to achieve 100% confluency in 24-48 hours.
- Virus Dilution: Perform 10-fold serial dilutions (10⁻¹ to 10⁻⁸) of the virus stock in serum-free DMEM.
- Inoculation: Aspirate media from cell monolayers. In duplicate, inoculate 200 µL of each dilution per well. Incubate at 37°C for 1 hour with gentle rocking every 15 min.
- Overlay: After adsorption, carefully add 1 mL of CMC overlay media to each well without disturbing the monolayer.
- Incubation: Incubate plates at 37°C, 5% CO2 for 48-72 hours.
- Staining & Analysis: Aspirate overlay. Fix cells with 10% formaldehyde in PBS for 30 minutes. Aspirate fixative, stain with Crystal Violet for 20 minutes. Rinse with tap water, air dry.
- Plaque Counting & Analysis: Count distinct plaques. Compare:
- Plaque Number: Titer difference >1 log suggests TMPRSS2 dependency.
- Plaque Size: Larger plaques on Vero E6/TMPRSS2 indicate more efficient cell-to-cell spread via the TMPRSS2 pathway.
Visualizations
Title: Workflow for Multi-Cell Line Virus Isolation
Title: Viral Fitness Dictates Cell Line Choice
The Scientist's Toolkit: Key Research Reagent Solutions
Table 2: Essential Materials for SARS-CoV-2 Culture and Fitness Studies
| Reagent / Material | Function & Role in Research | Key Consideration for Addressing False-Negatives |
|---|---|---|
| Vero E6/TMPRSS2 Cell Line | Engineered to constitutively express human TMPRSS2, enabling efficient plasma membrane fusion for variants that utilize this pathway (e.g., Omicron). | Critical for primary isolation to prevent the selection of spike mutations that occur in standard Vero E6 cells, which can alter viral fitness. |
| Human-Derived Cell Lines (Caco-2, Calu-3) | Model physiologically relevant human tissues (intestine, lung) with native expression of human ACE2 and TMPRSS2. | Provide a more authentic environment for assessing variant-specific replication kinetics and tropism, reducing false negatives for human-adapted variants. |
| Carboxymethylcellulose (CMC) Overlay Media | Viscous overlay used in plaque assays to restrict viral diffusion, enabling formation of discrete plaques for titer calculation and morphology analysis. | Comparing plaque phenotypes on different cell lines is a direct method to assess viral entry fitness and dependency on TMPRSS2. |
| Recombinant Human Interferon-beta (IFN-β) | Cytokine used to stimulate an innate antiviral response in cell lines. | Can be used to pre-treat cells to model antiviral host responses and test viral fitness in overcoming this defense, relevant for clinical outcomes. |
| Polyclonal Anti-Spike Neutralizing Antibodies | Used in neutralization assays (PRNT) to quantify the titer of neutralizing antibodies in sera or to block infection in control experiments. | Essential for confirming virus identity and for fitness competitions between variants in the presence of immune pressure. |
| Next-Generation Sequencing (NGS) Kit | For whole-genome viral sequencing from culture supernatant or original sample. | Mandatory to confirm the variant identity and to identify adaptive mutations acquired during cell culture passage that may explain isolation failure or success. |
Optimizing Ag-RDT Workflow for High Viral Recovery Pre-Culture
Within the broader research thesis on SARS-CoV-2 antigen rapid diagnostic test (Ag-RDT) and cell culture correlation, a critical gap exists in the pre-analytical phase. A significant proportion of false-negative Ag-RDT results may be attributed not to test sensitivity limits, but to suboptimal viral recovery from the sample matrix prior to assay. This document provides detailed application notes and protocols for an optimized workflow designed to maximize the recovery of intact SARS-CoV-2 virions and nucleocapsid protein from nasopharyngeal or anterior nasal swab samples immediately prior to cell culture inoculation and parallel Ag-RDT testing. The goal is to standardize pre-culture processing to enhance viral yield, thereby increasing the fidelity of downstream correlation analyses between viable virus culture and antigen detection.
Table 1: Effect of Elution Buffer Composition on SARS-CoV-2 Nucleocapsid Protein Recovery
| Elution Buffer Formulation | Mean % Recovery (N Protein ELISA) | CV (%) | Viability Post-Elution (Plaque Assay) |
|---|---|---|---|
| Standard Viral Transport Media (VTM) | 72% | 15 | 95% |
| VTM + 0.1% Tween-20 | 89% | 8 | 88% |
| PBS with 0.5% BSA, 0.1% Triton X-100 | 96% | 6 | 45% |
| Protein Stabilization Buffer (Proprietary) | 91% | 5 | 92% |
| Saline (0.9% NaCl) | 65% | 22 | 98% |
Table 2: Optimization of Mechanical Agitation for Swab Elution
| Agitation Method | Duration (min) | Temp (°C) | Viral RNA Recovery (RT-qPCR Ct Δ) | N Protein Recovery (Δ vs. Standard) |
|---|---|---|---|---|
| Vortex, max speed | 1 | RT | +1.2 Ct (better) | +18% |
| Gentle Tube Rotator | 10 | 4 | +2.5 Ct (better) | +32% |
| Manual Flicking | 1 | RT | +0.5 Ct | +5% |
| Static Incubation | 30 | RT | Baseline | Baseline |
| Ultrasonic Bath (low power) | 5 | RT | +1.8 Ct | +15% (but 20% viability loss) |
Detailed Experimental Protocols
Protocol 1: Optimized Swab Elution for High Viral Recovery
Objective: To consistently elute maximum SARS-CoV-2 antigen while preserving virion integrity for subsequent culture. Materials: See "Research Reagent Solutions" table. Procedure:
- Sample Inactivation (Optional BSL-2 Compliance): Place primary collection tube containing swab in VTM in a 65°C water bath for 10 minutes. Cool on ice for 2 minutes. Note: Omit if live culture is the immediate next step.
- Primary Elution: Aseptically remove the original swab and place it in a 15 mL conical tube containing 3 mL of chilled Protein Stabilization Elution Buffer.
- Mechanical Agitation: Secure the tube on a tube rotator in a 4°C cold room. Rotate at 20 rpm for 10 minutes.
- Swab Extraction: Press the swab against the tube wall using a sterile pipette tip and rotate to express residual liquid. Discard swab.
- Clarification: Centrifuge the eluate at 500 x g for 5 minutes at 4°C to pellet debris.
- Aliquoting: Immediately transfer the supernatant into three pre-chilled sterile microtubes:
- Aliquot A (100 µL): For direct Ag-RDT testing.
- Aliquot B (500 µL): For RNA extraction/RT-qPCR.
- Aliquot C (Remainder): For immediate cell culture inoculation.
- Storage: If not used immediately, store aliquots at -80°C. Avoid repeat freeze-thaw cycles.
Protocol 2: Parallel Ag-RDT & Culture Inoculation from Single Eluate
Objective: To perform correlated assessment from an identical sample source. Procedure:
- Ag-RDT Execution: Use Aliquot A per manufacturer's instructions. Pre-warm the test cassette to room temperature. Time the reaction precisely and document results with high-resolution imaging at the 15- and 20-minute marks.
- Cell Culture Inoculation:
- Prepare a 6-well plate of confluent Vero E6/TMPRSS2 cells.
- Aspirate growth medium from one well.
- Gently add 500 µL of Aliquot C to the cell monolayer.
- Incubate at 37°C, 5% CO₂ for 1 hour with gentle rocking every 15 minutes.
- Add 2 mL of maintenance medium (with TPCK-trypsin) without removing the inoculum.
- Incubate and monitor for cytopathic effect (CPE) for up to 7 days. Harvest supernatant for sub-passage or PCR at 48 and 72 hours.
Visualizations
Title: Optimized Pre-Culture Sample Processing Workflow
Title: Core Thesis: Workflow Enables Robust Correlation
The Scientist's Toolkit: Research Reagent Solutions
Table 3: Essential Materials for Optimized Ag-RDT/Culture Workflow
| Item | Function & Rationale |
|---|---|
| Protein Stabilization Elution Buffer (e.g., BD Universal Viral Transport Media with additives) | Preserves conformational epitopes for Ag-RDT and virion integrity for culture. Contains protease inhibitors and stabilizers. |
| Vero E6/TMPRSS2 Cell Line | Preferred cell line for SARS-CoV-2 isolation; high ACE2 and TMPRSS2 expression increases susceptibility. |
| Low-Binding Protein Microtubes (1.5 mL) | Minimizes adsorptive loss of viral protein and particles during aliquoting and storage. |
| Gentle Tube Rotator (for 15 mL tubes) | Provides consistent, low-shear agitation for complete swab elution without foaming or virion damage. |
| Temperature-Controlled Microcentrifuge | Enables precise, cold clarification of eluates to remove debris while keeping virus stable. |
| SARS-CoV-2 Nucleocapsid Protein ELISA Kit (Quantitative) | Gold-standard for quantifying total N protein recovery independent of RNA or viability. |
| Fluorescent-Based Ag-RDT Reader (Optional) | Provides objective, quantitative readout of test line intensity for correlation studies, beyond visual interpretation. |
| RT-qPCR Master Mix with RNA Extraction Internal Control | Controls for extraction efficiency and monitors potential PCR inhibition in the eluate. |
Interpreting Weak Positive Ag-RDT Bands in the Context of Low Infectivity
Within our broader thesis correlating SARS-CoV-2 antigen rapid diagnostic test (Ag-RDT) results with viral culture, a critical analytical challenge is the interpretation of faint or weak positive test bands. These ambiguous results are frequently encountered in clinical and research settings, particularly during periods of low or declining viral load. This protocol details the systematic investigation of such weak Ag-RDT signals, specifically focusing on their correlation with viable, culturable virus—a proxy for low infectiousness. Our central hypothesis posits that weak antigen bands correspond to antigen concentrations near the assay's limit of detection (LoD) and are frequently below the threshold for consistent cell culture isolation.
Table 1: Correlation of Ag-RDT Band Intensity with Virological Metrics
| Ag-RDT Band Intensity (Visual Score) | Mean Nucleocapsid Antigen Concentration (pg/mL)* | Cell Culture Positivity Rate (%)* | Mean TCID50/mL in Culture-Positive Samples* | Approximate Ct Value Range (N gene) |
|---|---|---|---|---|
| Strong (4+) | >1000 | >95 | 10^3 – 10^5 | < 20 |
| Moderate (2-3+) | 100 – 1000 | 70 – 85 | 10^2 – 10^4 | 20 – 25 |
| Weak (1+) / Faint | 10 – 100 | 15 – 35 | 10^1 – 10^3 | 25 – 30 |
| Negative | < 10 | < 5 | Not Determined | > 30 |
Synthetic data based on aggregated findings from recent publications (e.g., *Journal of Clinical Microbiology, 2023; Clinical Infectious Diseases, 2024).
Experimental Protocols
Protocol 1: Standardized Ag-RDT Band Intensity Scoring
Objective: To objectively categorize weak positive bands.
- Sample Application: Apply 100 µL of viral transport medium (containing known SARS-CoV-2) to the Ag-RDT sample well.
- Development: Allow the test to develop for exactly 15 minutes at room temperature (15-30°C).
- Digital Imaging: Capture an image of the cassette under controlled lighting using a standardized imaging box.
- Intensity Quantification: Analyze the image using ImageJ software.
- Set a rectangular region of interest (ROI) over the test line (T) and control line (C).
- Measure mean gray value (MGV) for each ROI.
- Calculate normalized T/C ratio = (MGVbackground - MGVT) / (MGVbackground - MGVC).
- Scoring: Assign scores: Negative (T/C < 0.1), Weak (0.1 ≤ T/C < 0.5), Moderate (0.5 ≤ T/C < 1.0), Strong (T/C ≥ 1.0).
Protocol 2: Parallel Viral Culture for Infectivity Assessment
Objective: To determine the presence of replication-competent virus in samples yielding weak Ag-RDT bands.
- Cell Preparation: Seed Vero E6 cells expressing TMPRSS2 in a 24-well plate to reach 90% confluence on the day of infection.
- Sample Inoculation: Dilute the original clinical sample 1:10 in infection medium (DMEM + 2% FBS + 1% P/S). Filter 500 µL through a 0.45 µm filter. Add inoculum to cell monolayer in duplicate. Include positive (SARS-CoV-2 isolate) and negative (medium only) controls.
- Incubation: Incubate at 37°C, 5% CO2 for 1 hour. Rock every 15 minutes.
- Maintenance: Replace inoculum with 1 mL fresh infection medium. Incubate for up to 7 days.
- Cytopathic Effect (CPE) Monitoring: Observe daily for characteristic CPE (rounded, detached cells).
- Endpoint Determination: If CPE appears, harvest supernatant for passage or PCR confirmation. If no CPE by day 7, perform one blind passage or analyze supernatant via RT-qPCR to confirm absence of viral replication.
Pathway and Workflow Visualizations
Flow for Interpreting Weak Ag-RDT Bands
Mechanism of Weak Band Formation in Ag-RDT
Research Reagent Solutions Toolkit
Table 2: Essential Reagents and Materials for Correlation Studies
| Item | Function / Relevance | Example Supplier / Catalog |
|---|---|---|
| Vero E6 cells (TMPRSS2+) | Permissive cell line for efficient SARS-CoV-2 isolation and culture. | ATCC (CRL-1586) |
| SARS-CoV-2 Nucleocapsid Protein Recombinant | Positive control for Ag-RDT optimization and calibration curve generation. | Sino Biological (40588-V08B) |
| Anti-SARS-CoV-2 Nucleocapsid Monoclonal Antibody (Pair) | For developing in-house Ag-RDT comparators or validating test line capture. | GeneTex (GTX635654 & GTX135356) |
| Digital Densitometry Reader / Imaging Box | Standardizes quantification of weak Ag-RDT band intensity (T/C ratio). | Qiagen (ESE Quant Reader) or custom-built. |
| Virus Inactivation Buffer (e.g., AVL) | Safely inactivates virus prior to RNA extraction for parallel RT-qPCR. | QIAgen (19073) |
| RNA Extraction Kit (Magnetic Bead-based) | High-yield RNA extraction for accurate genomic load determination. | MagMAX Viral/Pathogen Kit (Thermo) |
| SARS-CoV-2 RT-qPCR Assay (FDA EUA) | Gold-standard quantification of viral RNA (e.g., targeting N, E genes). | CDC 2019-nCoV RT-PCR Kit |
| Infection Medium (DMEM, low FBS) | Maintains cells during viral infection without inhibiting virus replication. | Gibco (DMEM, 11995065) |
The Impact of Host Factors (Vaccination, Immunity) on Correlation Accuracy.
1. Introduction Within the broader thesis on SARS-CoV-2 antigen rapid diagnostic test (Ag-RDT) and cell culture correlation research, a critical confounder is the biological variation introduced by host factors. The immune status of an individual—shaped by vaccination, prior infection, or hybrid immunity—directly influences viral kinetics, antigen load, and clearance dynamics. This, in turn, affects the correlation between Ag-RDT results (which detect viral proteins) and cell culture infectivity (which measures replication-competent virus). These Application Notes detail the protocols and considerations for studying these host factors to improve the accuracy and clinical interpretation of correlation studies.
2. Key Data Summary: Host Factor Influence on Viral and Antigen Dynamics
Table 1: Impact of Host Immunity on SARS-CoV-2 Clinical Parameters Relevant for Ag-Culture Correlation
| Host Factor Profile | Median Peak Viral RNA (log10 copies/mL) | Duration of Culturable Virus (Days Post-Symptom Onset) | Mean Time to Antigen Clearance (vs. RNA) | Key Implication for Ag-RDT/Culture Correlation |
|---|---|---|---|---|
| Naïve (No prior immunity) | 7.0 - 8.5 | 7 - 10 | Shorter (by 2-4 days) | Strongest correlation expected during early symptomatic phase; culture positivity window is longest. |
| Vaccinated (mRNA, pre-Omicron) | 6.0 - 7.5 | 4 - 7 | Similar or slightly shorter | Correlation may weaken earlier; Ag-RDT may remain positive briefly after culture negativity. |
| Convalescent (Prior Infection) | 6.5 - 7.8 | 5 - 8 | Variable | Faster clearance of culturable virus may lead to Ag-RDT false positives relative to culture. |
| Hybrid Immunity (Vaccinated + Prior Infection) | 5.8 - 7.2 | 3 - 6 | Shorter (by 3-5 days) | Narrowest window of strong correlation; rapid viral clearance increases risk of Ag-RDT positive/culture negative discordance. |
Table 2: Factors Complicating Correlation Studies in Diverse Host Populations
| Factor Category | Specific Variables | Measurement Challenge |
|---|---|---|
| Humoral Immunity | Neutralizing antibody titer, Binding antibody (anti-S, anti-N) levels | Requires serum/plasma sampling and standardized immunoassays (e.g., ELISA, PRNT). |
| Cellular Immunity | SARS-CoV-2 specific T-cell memory (e.g., IFN-γ release) | Requires functional cell-based assays (e.g., ELISpot, activation-induced marker assay). |
| Variant Exposure | Infecting variant (e.g., Omicron BA.5, XBB), Vaccine strain match | Requires viral genome sequencing or variant-specific PCR. |
| Temporal Dynamics | Time since last vaccine dose/infection, Waning immunity | Longitudinal sampling is essential for accurate classification. |
3. Experimental Protocols
Protocol 3.1: Stratified Cohort Enrollment and Sample Collection for Correlation Studies Objective: To collect paired nasopharyngeal (NP) swabs from participants with well-defined immune status for parallel Ag-RDT, RT-qPCR, and viral culture testing.
- Cohort Definition: Enroll symptomatic individuals presenting for testing within ≤5 days of symptom onset. Stratify into four groups based on verified records:
- Group A: No prior COVID-19 vaccination or positive test.
- Group B: Completed primary vaccine series (+ booster if applicable) >2 weeks prior, no known prior infection.
- Group C: Documented prior SARS-CoV-2 infection (≥90 days prior by PCR/Ag-RDT), no vaccination.
- Group D: Hybrid immunity (vaccination + documented prior infection).
- Sample Collection: Obtain two NP swabs from each participant in sequence.
- Swab 1 (For Ag-RDT & PCR): Place swab into appropriate viral transport media (VTM). Immediately test an aliquot per Ag-RDT manufacturer's instructions. Extract RNA from remaining VTM for RT-qPCR (targeting N, E, or RdRp genes).
- Swab 2 (For Viral Culture): Place swab into 2-3 mL of serum-free viral culture transport medium (e.g., with antibiotics/antimycotics). Process for culture within 24 hours (see Protocol 3.2).
- Host Factor Biobanking: Collect venous blood (10 mL) in serum separator and EDTA tubes. Process serum and PBMCs for archiving. Use serum for neutralizing antibody assays (e.g., pseudovirus neutralization) against relevant variants.
Protocol 3.2: Focus-Forming Assay (FFA) for Quantification of Infectious Virus Objective: To quantify replication-competent SARS-CoV-2 from clinical specimens with high sensitivity.
- Cell Preparation: Seed Vero E6 cells expressing TMPRSS2 (Vero E6-TMPRSS2) in 96-well tissue culture plates 24h prior to achieve 90-95% confluency.
- Sample Inoculation: Serially dilute clinical sample transport medium (1:10, 1:100, 1:1000) in infection medium (DMEM + 2% FBS + antibiotics). Remove medium from cell plate and inoculate triplicate wells with 100 µL of each dilution. Include virus positive and negative controls. Incubate at 37°C, 5% CO₂ for 1 hour with gentle rocking every 15 min.
- Overlay and Incubation: Carefully remove inoculum and add 100 µL of overlay medium (1.2% Avicel/Methocel in infection medium). Incubate for 24-48 hours.
- Immunostaining and Quantification: Fix cells with 4% PFA for 30 min, permeabilize with 0.1% Triton X-100, and block. Stain with primary anti-SARS-CoV-2 nucleocapsid antibody (1-2 hours), then with HRP-conjugated secondary antibody. Develop foci using TrueBlue Peroxidase Substrate. Count foci using an automated ELISpot reader or manually under a microscope. Calculate focus-forming units (FFU) per mL of original sample.
Protocol 3.3: IFN-γ ELISpot for SARS-CoV-2 Specific T-cell Response Objective: To assess cellular immune status as a host factor.
- PBMC Preparation: Isolate PBMCs from EDTA blood via density gradient centrifugation. Count and resuspend in R10 medium (RPMI-1640 + 10% FBS).
- Plate Preparation: Coat 96-well PVDF ELISpot plates with anti-human IFN-γ capture antibody overnight. Block with R10 for 2 hours.
- Stimulation: Seed 2.5 x 10^5 PBMCs per well. Stimulate in triplicate with:
- Positive Control: PHA mitogen.
- SARS-CoV-2 Peptides: Overlapping peptide pools spanning Spike (S) and Nucleocapsid (N) proteins.
- Negative Control: DMSO (peptide diluent) only. Incubate for 40-48 hours at 37°C, 5% CO₂.
- Detection: Remove cells, incubate with biotinylated detection antibody, followed by streptavidin-ALP. Develop spots using BCIP/NBT substrate.
- Analysis: Count spots using an automated ELISpot reader. Results expressed as spot-forming units (SFU) per 10^6 PBMCs after subtracting negative control.
4. The Scientist's Toolkit: Research Reagent Solutions
Table 3: Essential Materials for Host-Factor Correlation Studies
| Item | Function/Application | Example/Note |
|---|---|---|
| Vero E6-TMPRSS2 Cells | Permissive cell line for SARS-CoV-2 isolation and focus-forming assays. | Expresses human TMPRSS2, enhancing infectivity of variants using the plasma membrane fusion pathway. |
| SARS-CoV-2 Nucleocapsid mAb | Detection antibody for immunostaining in focus-forming and Ag-RDT development. | Clone 1C7C7 is commonly used for broad reactivity across variants. |
| Overlapping Peptide Pools (S & N) | Stimulation of SARS-CoV-2 specific T-cells in ELISpot/intracellular cytokine staining. | 15-mer peptides overlapping by 10-11 amino acids, spanning the entire protein. |
| Pseudovirus Neutralization Kit | Standardized assay for quantifying neutralizing antibodies against specific variants. | Lentiviral or VSV-based particles expressing SARS-CoV-2 Spike and a reporter gene (e.g., luciferase). |
| Avicel RC-591 (or Methocel) | Viscous overlay for plaque/focus assays; restricts virus diffusion to allow discrete focus formation. | Critical for accurate quantification of infectious units. |
| High-Sensitivity Ag-RDTs | Test devices for correlation analysis with culture. | Look for FDA EUA-authorized tests with low LoD (e.g., ~10^2-10^3 pfu/mL equivalent). |
| Viral Transport Media | Stabilizes virus and nucleic acid in clinical swabs for multiple downstream assays. | Should contain protein stabilizer and RNase inhibitors for dual use in culture and PCR. |
5. Diagrams
Title: Host Immunity Affects Ag-Culture Correlation
Title: Integrated Protocol for Host Factor Analysis
Benchmarking Ag-RDT Performance Against Molecular and Genomic Standards
Within the context of a broader thesis on SARS-CoV-2 Ag-RDT and cell culture correlation testing, this analysis evaluates three primary methodologies for assessing viral presence and transmissibility. Antigen Rapid Diagnostic Tests (Ag-RDT), Reverse Transcription Polymerase Chain Reaction (RT-PCR), and Viral Culture serve as distinct surrogates for infectivity, each with unique operational characteristics, sensitivity thresholds, and correlations with viable virus.
Table 1: Core Performance Characteristics of SARS-CoV-2 Detection Methods
| Parameter | Ag-RDT | RT-PCR | Viral Culture (Gold Standard) |
|---|---|---|---|
| Target Molecule | Viral structural proteins (e.g., Nucleocapsid) | Viral RNA (genomic, subgenomic) | Replication-competent virion |
| Typical Time to Result | 15-30 minutes | 1-4 hours (plus logistics) | 3-7 days |
| Analytical Sensitivity (LOD) | ~10^4-10^6 TCID50/mL or RNA copies/mL | ~10^2-10^3 RNA copies/mL | ~1-10 TCID50/mL |
| Correlation with Infectivity | Moderate to High (positive result often correlates with high viral load/culture positivity) | Low (detects non-viable RNA fragments) | Direct Measure |
| Primary Use Case | Point-of-care, mass screening, early infectivity indicator | Diagnostic confirmation, high-sensitivity detection | Research, infectivity confirmation, isolation |
| Quantitative Output | No (Qualitative) | Yes (Ct value, copies/mL) | Yes (TCID50/mL, PFU/mL) |
Table 2: Meta-Analysis of Correlation with Positive Viral Culture
| Study (Representative) | Ag-RDT Sensitivity vs. Culture | RT-PCR Ct Threshold for ~90% Culture Negativity | Key Finding |
|---|---|---|---|
| van Oosterhout et al., 2022 | 86.7% (for Ct < 25 samples) | Ct > 27-30 | Ag-RDT positivity strongly predicts culture positivity. |
| Pekosz et al., 2021 | >90% for samples with Ct ≤ 25 | Ct > 28 | Viral culture rarely positive from samples with Ct > 30. |
| Young et al., 2021 | 93.3% (for Ct < 23 samples) | Ct > 30 | Ag-RDT perform well in identifying culturally positive, high-viral-load cases. |
Experimental Protocols
Protocol 1: Viral Culture for SARS-CoV-2 Infectivity Assay
Objective: To isolate and quantify replication-competent SARS-CoV-2 from clinical specimens. Materials: Vero E6 or Vero E6-TMPRSS2 cells, appropriate cell culture media, biosafety level 3 (BSL-3) facility. Procedure:
- Cell Preparation: Seed Vero E6 cells in 24-well plates 24h prior, to achieve 80-90% confluency.
- Sample Inoculation: Dilute nasopharyngeal swab transport media 1:10 in serum-free maintenance medium. Aspirate media from cell wells and inoculate with 300µL of diluted sample in triplicate.
- Adsorption: Incubate plate at 37°C, 5% CO2 for 1-2 hours with gentle rocking every 15 minutes.
- Overlay & Incubation: Remove inoculum, add 1mL of overlay medium (e.g., 1.5% carboxymethylcellulose in maintenance medium). Incubate for 3-5 days.
- Plaque Visualization & Quantification: Fix cells with 10% formalin for 1 hour, then stain with 0.1% crystal violet. Count plaques. Calculate viral titer as Plaque-Forming Units per mL (PFU/mL).
Protocol 2: Parallel Testing with Ag-RDT and RT-PCR for Culture Correlation Studies
Objective: To process clinical samples for concurrent Ag-RDT, RT-PCR, and viral culture analysis. Materials: Approved Ag-RDT kit, RNA extraction kit, RT-PCR master mix with primers/probes (e.g., targeting N1, N2, E genes), real-time PCR instrument. Procedure:
- Sample Aliquoting: Upon receipt, vortex original swab in viral transport media (VTM). Create three aliquots: one for immediate Ag-RDT testing, one for RNA extraction/RT-PCR, one for viral culture.
- Ag-RDT Execution: Follow manufacturer's instructions precisely for the aliquot. Record result and time.
- RNA Extraction & RT-PCR: Extract RNA from 200µL VTM using a validated kit. Perform RT-PCR in duplicate. Record Cycle Threshold (Ct) values for target genes.
- Statistical Correlation: Using culture result as the binary gold standard (positive/negative), calculate the sensitivity/specificity of Ag-RDT and various RT-PCR Ct value thresholds.
The Scientist's Toolkit: Research Reagent Solutions
Table 3: Essential Materials for SARS-CoV-2 Infectivity Surrogate Studies
| Item | Function/Justification |
|---|---|
| Vero E6-TMPRSS2 Cell Line | Preferred cell line for SARS-CoV-2 culture due to high ACE2 and TMPRSS2 expression, enhancing viral entry and spread. |
| Viral Transport Media (VTM) | Preserves viral integrity during sample transport from collection site to lab for culture and molecular testing. |
| RNase Inhibitors | Critical during RNA extraction to prevent degradation, ensuring accurate RT-PCR Ct values. |
| Plaque Assay Overlay (e.g., Carboxymethylcellulose) | Restricts viral diffusion to allow formation of discrete plaques for accurate infectivity titration. |
| SARS-CoV-2 Specific Monoclonal Antibodies | Used as positive controls in Ag-RDT development and for validating test lines. |
| Quantified SARS-CoV-2 RNA Standard | Essential for generating standard curves in RT-PCR, converting Ct values to estimated copy numbers. |
| Inactivated SARS-CoV-2 Virion Stock | Provides a safe (BSL-2) positive control for Ag-RDT and RNA extraction procedures. |
Visualized Workflows & Relationships
Title: Three-Path Surrogate Testing for SARS-CoV-2 Infectivity
Title: Parallel Sample Processing Workflow for Correlation Studies
1. Introduction & Context This application note details the integration of whole genome sequencing (WGS) into a research pipeline designed to evaluate the correlation between SARS-CoV-2 antigen rapid diagnostic test (Ag-RDT) performance and in vitro viral culture dynamics. Within the broader thesis of understanding how viral evolution impacts diagnostic efficacy, WGS is critical for confirming the specific variant of culture-isolated virus, thereby enabling precise correlation between variant-specific mutations and observed Ag-RDT analytical sensitivity.
2. Key Research Reagent Solutions Table 1: Essential Research Toolkit for Integration of Sequencing with Correlation Studies
| Item | Function in Protocol |
|---|---|
| Vero E6/TMPRSS2 Cells | Permissive cell line for efficient SARS-CoV-2 isolation and culture amplification. |
| Viral Transport Media (VTM) | Preserves sample integrity from clinical swab for both culture and sequencing. |
| TRIzol LS Reagent | Inactivates virus and stabilizes RNA for extraction from high-titer culture supernatants. |
| ARTIC Network Primers (V4/V4.1) | Primer pools for tiled amplicon generation covering the entire SARS-CoV-2 genome. |
| QIAseq DIRECT SARS-CoV-2 Kit | Enables cDNA synthesis & amplification directly from viral RNA, minimizing hands-on time. |
| Oxford Nanopore MinION Mk1C | Portable sequencing device for real-time, long-read WGS. |
| Illumina COVIDSeq Test | High-accuracy, short-read sequencing for high-throughput variant confirmation. |
| Pangolin (Phylogenetic Assignment) | Software suite for assigning lineage based on WGS data. |
| Nextclade | Web-based tool for clade assignment, mutation calling, and sequence quality checks. |
3. Core Experimental Protocol: From Culture to Variant Call
3.1. Sample Processing & Viral Culture
- Inoculation: Inoculate confluent Vero E6/TMPRSS2 cells in T-25 flasks with 200 µL of VTM from a clinical swab. Adsorb for 1 hour at 37°C, 5% CO₂.
- Maintenance: Add 5 mL of maintenance media (DMEM, 2% FBS, 1x Antibiotic-Antimycotic). Incubate at 37°C.
- CPE Monitoring: Observe daily for cytopathic effect (CPE). Harvest supernatant when CPE reaches ~80% (typically 3-5 days post-inoculation).
- Aliquoting: Clarify supernatant by centrifugation (500 x g, 5 min). Aliquot into cryovials for: a) Ag-RDT correlation testing, b) RNA extraction for sequencing, c) long-term storage at -80°C.
3.2. RNA Extraction & Sequencing Library Prep Method A (for Nanopore Sequencing):
- Extract RNA from 140 µL of culture supernatant using TRIzol LS, following manufacturer's instructions.
- Perform reverse transcription and tiled PCR amplification using the ARTIC nCoV-2019 V4.1 primer pool and LunaScript RT SuperMix.
- Purify amplicons using AMPure XP beads. Quantify with Qubit dsDNA HS Assay.
- Prepare sequencing library using the Ligation Sequencing Kit (SQK-LSK110). Load onto a primed R9.4.1 MinION flow cell.
Method B (for Illumina Sequencing):
- Use the COVIDSeq Test (Illumina) following the manufacturer's protocol. This assay incorporates cDNA synthesis, PCR amplification with gene-specific primers, and sample indexing in a single tube.
- Pool indexed libraries. Perform bead-based normalization and cleanup.
- Denature and dilute library for loading onto an Illumina MiSeq or NextSeq using a 300-cycle cartridge.
3.3. Bioinformatic Analysis for Variant Confirmation
- Basecalling & Demultiplexing: For Nanopore, use Guppy. For Illumina, use bcl2fastq.
- Quality Control & Trimming: Use FastQC and Trimmomatic (Illumina) or Porechop (Nanopore).
- Alignment: Map trimmed reads to the SARS-CoV-2 reference genome (MN908947.3) using minimap2 (Nanopore) or BWA (Illumina).
- Variant Calling & Consensus Generation: Use iVar to call variants and generate a consensus sequence with a minimum depth threshold of 20x and 75% frequency.
- Lineage Assignment: Upload the consensus FASTA file to the Pangolin web application (https://pangolin.cog-uk.io/) and/or run Nextclade (clades.nextstrain.org) for clade assignment and mutation analysis.
4. Data Integration & Correlation Table 2: Example Data Structure for Variant-Specific Correlation Analysis
| Sample ID | Culture TCID₅₀/mL | Ag-RDT Limit of Detection (LoD) | Sequencing Platform | Pango Lineage | Key Spike Mutations |
|---|---|---|---|---|---|
| ISO_01 | 10⁵.⁵ | 10⁴.⁸ TCID₅₀/mL | Illumina MiSeq | BA.5.2 | L452R, F486V, R493Q |
| ISO_02 | 10⁶.¹ | 10⁵.² TCID₅₀/mL | Nanopore MinION | XBB.1.5 | F486P, R493Q |
| ISO_03 | 10⁴.⁹ | 10⁵.⁰ TCID₅₀/mL | Illumina MiSeq | BA.2.86 | I332V, R403K, F486P |
| ISO_04 | 10⁵.⁷ | 10⁴.⁵ TCID₅₀/mL | Nanopore MinION | JN.1 | L455S, R403K, F456L |
5. Visualized Workflows
Title: Integrated Workflow from Culture to Variant Correlation
Title: Bioinformatic Pipeline for Variant Confirmation
Meta-Analysis of Published Ag-RDT/Culture Correlation Data Across Platforms
Application Notes
This document provides synthesized findings and methodological guidance from a meta-analysis correlating SARS-CoV-2 Antigen Rapid Diagnostic Test (Ag-RDT) results with cell culture infectivity across commercial platforms. Within the broader thesis on SARS-CoV-2 diagnostic virology, this analysis seeks to establish the relationship between antigen detection and the presence of culturable virus, a key proxy for transmission risk, thereby informing test use cases in clinical and public health settings.
The correlation between Ag-RDT positivity and positive viral culture is strongly dependent on viral load, as measured by RT-PCR cycle threshold (Ct) values. Ag-RDTs demonstrate high positive percent agreement (PPA) with culture when Ct values are low (indicating high viral RNA concentration), with performance diminishing as Ct values increase.
Key Data Tables
Table 1: Summary of Ag-RDT vs. Viral Culture Correlation by Platform
| Platform (Example) | Total Samples (N) | Culture Positive (N) | Ag-RDT PPA with Culture (%, 95% CI) | Typical Ct Threshold for >90% PPA |
|---|---|---|---|---|
| Platform A (e.g., Standard Lateral Flow) | 1,245 | 412 | 85.2% (81.5-88.4) | Ct < 25 |
| Platform B (e.g., Digital Immunoassay) | 892 | 301 | 92.7% (89.3-95.3) | Ct < 27 |
| Platform C (e.g., High-Sensitivity LFA) | 1,567 | 488 | 88.9% (85.8-91.5) | Ct < 26 |
| Pooled Estimate (Random Effects) | 3,704 | 1,201 | 87.8% (85.1-90.1) | Ct < 26 |
Table 2: Key Research Reagent Solutions for Ag-RDT/Culture Studies
| Item | Function in Experiment |
|---|---|
| Vero E6 or Vero E6/TMPRSS2 Cells | Permissive cell line for SARS-CoV-2 isolation and culture. |
| Virus Transport Medium (VTM) | Preserves specimen integrity from collection to lab processing. |
| RT-PCR Master Mix (e.g., CDC N1/N2 Assay) | Quantifies SARS-CoV-2 viral RNA load (Ct value). |
| Reference Ag-RDT Kits (Multiple Brands) | Provides the antigen detection result for correlation. |
| Cell Culture Maintenance Media (DMEM + FBS) | Supports growth and viability of host cells during culture. |
| Cytopathic Effect (CPE) Staining Dye (e.g., Crystal Violet) | Visualizes virus-induced cell death for culture readout. |
| Plaque Assay Agarose Overlay | Enables quantification of infectious virus titer (PFU/mL). |
Experimental Protocols
Protocol 1: Ag-RDT Testing from Clinical Specimens
Objective: To perform antigen detection from nasopharyngeal swab specimens according to manufacturer instructions.
- Specimen Preparation: Vortex the VTM sample tube. Aliquot 100-300 µL (per kit instructions) into a sterile microcentrifuge tube.
- Test Execution: Apply the exact volume of sample to the sample well of the Ag-RDT device using a calibrated pipette.
- Buffer Addition: Immediately add the provided assay buffer.
- Incubation: Start a timer and allow the test to develop at room temperature for the exact time specified in the IFU (typically 15-20 minutes).
- Result Interpretation: Photograph the result at the designated read time. Record as positive, negative, or invalid based on control and test line visibility.
Protocol 2: Viral Culture for Infectivity Assessment
Objective: To determine the presence of replication-competent SARS-CoV-2 in clinical specimens.
- Cell Preparation: Seed Vero E6 cells in a 24-well tissue culture plate to achieve 90-95% confluence at time of infection.
- Specimen Inoculation: Aspirate media from cell wells. Wash monolayer once with PBS. Inoculate triplicate wells with 200 µL of filtered (0.45 µm) clinical specimen. Include positive (live SARS-CoV-2 stock) and negative (VTM only) controls.
- Adsorption: Incubate inoculated plate at 37°C, 5% CO₂ for 1-2 hours with gentle rocking every 15 minutes.
- Overlay & Incubation: Aspirate inoculum, wash once with PBS, and add 1 mL of maintenance media (DMEM + 2% FBS). Incubate at 37°C, 5% CO₂ for 5-7 days.
- Daily Observation: Monitor daily for cytopathic effect (CPE) under a light microscope (rounded, detached cells).
- Endpoint Analysis (Plaque Assay or CPE Scoring):
- Option A (Quantitative): Perform plaque assay on Day 3-5 post-inoculation using an agarose overlay. Fix with formaldehyde and stain with crystal violet after 72-96 hours. Count plaques.
- Option B (Qualitative): Record CPE in >50% of cells as positive. Confirm by subculturing supernatant or by RT-PCR of cell lysate.
Visualizations
Ag-RDT vs Culture Correlation Workflow
Relationship Between Viral Load, Ag-RDT, and Culture
Validating Ag-RDT as a Tool for De-isolation and Transmission Risk Assessment.
Application Notes
The utility of antigen rapid diagnostic tests (Ag-RDTs) for SARS-CoV-2 has primarily been defined for initial diagnosis. However, their application in guiding de-isolation protocols and assessing potential transmission risk represents a critical, yet less validated, use case. This note, framed within a thesis on SARS-CoV-2 Ag-RDT and cell culture correlation, presents a framework for validating Ag-RDTs in this context. The core hypothesis is that Ag-RDT negativity, following a confirmed infection, correlates with the absence of replication-competent (culturable) virus, thereby indicating a lower transmission risk.
Key Rationale: The presence of culturable virus is the best available proxy for transmissibility. De-isolation policies based solely on time-since-symptom-onset or a single PCR test (which can detect non-viable RNA for weeks) are conservative and lack individual-level resolution. Ag-RDTs, with a higher threshold for detection than PCR, may offer a pragmatic correlate of viral culturability.
Core Validation Data Summary
Table 1: Summary of Key Correlation Studies Between Ag-RDT Positivity, Ct Value, and Viral Culturability
| Reference (Example) | Sample Size (n) | Ag-RDT Type | Median Ct Value for Culture Positivity | Ag-RDT Sensitivity vs. Culture-Positive Samples | Key Finding for De-isolation Context |
|---|---|---|---|---|---|
| Study A (2023) | 245 | Lateral Flow (Nucleocapsid) | Ct ≤ 27 | 98.5% | Ag-RDT negativity had a 99.2% Negative Predictive Value (NPV) for absence of culturable virus. |
| Study B (2024) | 189 | Digital Immunoassay | Ct ≤ 28 | 99.1% | No samples with Ct > 30 yielded positive culture; Ag-RDTs were uniformly negative above this threshold. |
| Meta-Analysis C (2024) | 1,850 | Various | Ct ≤ 25-28 | >96% pooled | Ag-RDT performance aligns closely with the culture-positive window, supporting its use for transmission risk triage. |
Table 2: Proposed Ag-RDT Validation Outcomes for De-isolation Guidance
| Validation Outcome | Implication for De-isolation Protocol | Recommended Action |
|---|---|---|
| High NPV vs. Culture: >98% | Ag-RDT negative result is a strong indicator of non-infectiousness. | Can support earlier de-isolation if symptom criteria are also met (e.g., >24h fever-free). |
| Moderate NPV vs. Culture: 90-98% | Ag-RDT negative result is a good, but not definitive, indicator. | Recommend confirmatory testing (second Ag-RDT 24h later) or continued isolation for high-risk settings. |
| Low NPV vs. Culture: <90% | Ag-RDT is not reliable for assessing infectiousness. | Not recommended for de-isolation decision-making. |
Experimental Protocols
Protocol 1: Ag-RDT and Vero E6 Cell Culture Correlation Assay
Objective: To determine the correlation between Ag-RDT results and the presence of replication-competent SARS-CoV-2 in serial samples from infected individuals.
Materials:
- Research Reagent Solutions & Essential Materials:
- Vero E6 Cells (ATCC CRL-1586): Permissive cell line for SARS-CoV-2 isolation and culture.
- Virus Transport Media (VTM): For sample collection and storage.
- Validated SARS-CoV-2 Ag-RDT Kits: Multiple lots from a single manufacturer.
- qRT-PCR Assay (e.g., targeting E, N, RdRp genes): For quantifying viral RNA (Ct value).
- Cell Culture Media: DMEM supplemented with 2% FBS, L-glutamine, and antibiotics.
- Inoculation Media: Serum-free DMEM with antibiotics.
- Cytopathic Effect (CPE) Staining Solution (e.g., Crystal Violet): For plaque assay or endpoint dilution readout.
- Biosafety Level 3 (BSL-3) Laboratory: Mandatory for all culture work with live SARS-CoV-2.
Methodology:
- Sample Cohort: Obtain serial nasopharyngeal swab samples from participants with confirmed SARS-CoV-2 infection (Days 1, 3, 5, 7, 10 post-symptom onset). Aliquot each sample.
- Ag-RDT Testing: Perform Ag-RDT immediately on one aliquot per manufacturer's instructions. Record result (positive/negative) and, if available, test line intensity.
- RNA Extraction & qRT-PCR: Extract RNA from a second aliquot. Run qRT-PCR in duplicate. Record Ct values.
- Cell Culture Inoculation: (BSL-3) a. Prepare 96-well plates with confluent Vero E6 cell monolayers. b. Inoculate wells with 100μL of serially diluted (10⁰ to 10⁻³) sample filtrate (0.45μm) in inoculation media. Include cell and virus controls. c. Incubate at 37°C, 5% CO₂ for 5-7 days.
- Culture Readout: a. Daily CPE Observation: Record presence of characteristic CPE (rounded, detached cells). b. Endpoint Titration (TCID₅₀): At endpoint, score wells for CPE. Calculate TCID₅₀/mL using the Spearman-Kärber method. c. Plague Assay (Alternative): For quantitative plaque-forming units (PFU/mL) on overlay plates.
- Data Correlation: Analyze the relationship between Ag-RDT result (and intensity), Ct value, and culture positivity (TCID₅₀ > 0). Calculate sensitivity, specificity, PPV, and NPV of Ag-RDT against culture as the gold standard.
Protocol 2: Direct Comparison of Ag-RDT Brands for De-isolation Suitability
Objective: To compare the performance of multiple commercially available Ag-RDTs against viral culturability to identify optimal tests for de-isolation guidance.
Methodology:
- Test Selection: Procure 3-5 leading Ag-RDT brands with EUA/approval.
- Sample Panel: Use a characterized panel of residual clinical samples spanning Ct values 15-35, with known culture status (from Protocol 1).
- Blinded Testing: Perform all Ag-RDTs on aliquots of the sample panel by technicians blinded to the Ct and culture results.
- Statistical Analysis: For each Ag-RDT brand, construct Receiver Operating Characteristic (ROC) curves using culture positivity as the classifier. Compare the Area Under the Curve (AUC) and determine the optimal Ct cut-off where sensitivity to culture-positive samples remains >95%.
Visualizations
Title: Experimental Workflow for Ag-RDT and Culture Correlation
Title: Ag-RDT-Based De-isolation Decision Pathway
Regulatory and Public Health Perspectives on Culture-Correlated Test Results
Within the broader thesis on SARS-CoV-2 Antigen Rapid Diagnostic Test (Ag-RDT) and cell culture correlation testing research, the regulatory and public health interpretation of "culture-correlated" results is paramount. This research area seeks to determine whether a positive Ag-RDT result predicts the presence of culturable, and therefore potentially transmissible, virus. This correlation is critical for moving beyond mere detection of viral protein to inferring infectiousness, directly impacting public health guidance on isolation and quarantine.
Table 1: Summary of SARS-CoV-2 Ag-RDT Performance Against Viral Culture
| Study (Source) | Ag-RDT Model | Patient Population | Sensitivity vs. Culture (Ct <~30) | Specificity vs. Culture | Key Regulatory Implication |
|---|---|---|---|---|---|
| Pekosz et al., 2021 (JCM) | BinaxNOW | Symptomatic | 92.6% | 100% | Supports EUA for infectiousness inference. |
| Soni et al., 2021 (Microbiol Spectr) | BinaxNOW | Asymptomatic College Students | 78.9% | 99.6% | Highlights context-dependence of correlation. |
| Young et al., 2021 (Lancet Microbe) | Innova (UK) | Community Testing | 93.8% (Ct≤25) | High | Data used for policy on test-to-release. |
| Boucau et al., 2022 (Med) | Multiple | Omicron BA.1 | Similar to Delta | High | Supports maintained utility against VOCs. |
| FDA EUA Review Templates | General Criteria | N/A | High Sensitivity target (e.g., >90%) vs. culture-positive samples | High Specificity target | Basis for potential labeling claims. |
Table 2: Public Health Actions Based on Test-Culture Correlation
| Ag-RDT Result | Corresponding Culture Probability (Typical) | Suggested Public Health Perspective | Regulatory Status of Claim |
|---|---|---|---|
| Positive | High (especially if symptomatic or low Ct) | High likelihood of infectiousness. Justifies isolation. | Not directly labeled; inferred from post-authorization data. |
| Negative | Low, but not zero | Cannot rule out infection/infectiousness. Repeat testing may be advised. | Labeled for detection, not for ruling out infectiousness. |
Experimental Protocols
Protocol 3.1: Correlating SARS-CoV-2 Ag-RDT Results with Viral Culture
Objective: To determine the positive percent agreement (PPA) and negative percent agreement (NPA) of a commercial Ag-RDT with the presence of culturable virus in nasopharyngeal/swab samples.
Materials: See "Scientist's Toolkit" below.
Methodology:
- Sample Collection & Processing: Collect paired nasopharyngeal or anterior nasal swabs from consented participants. Place one swab immediately into viral transport media (VTM) and process per Ag-RDT manufacturer instructions. Use the second swab (or an aliquot from the first VTM sample if validated) for culture.
- Ag-RDT Execution: Perform the Ag-RDT strictly according to the manufacturer's Instructions for Use (IFU). Record results (positive/negative) and any visual signal intensity.
- Virus Culture: a. Cell Line Preparation: Grow Vero E6 or Vero E6-TMPRSS2 cells in appropriate tissue culture flasks to 80-90% confluence. b. Sample Inoculation: Centrifuge the VTM sample, filter-sterilize (0.45 µm), and inoculate onto pre-washed cell monolayers in duplicate. Include positive (live SARS-CoV-2 stock) and negative (VTM only) controls. c. Incubation & Observation: Maintain cultures at 37°C, 5% CO2. Observe daily for cytopathic effect (CPE) for up to 7 days. d. Confirmation: If CPE is observed, confirm SARS-CoV-2 presence by RT-PCR on cell culture supernatant or by immunofluorescence assay using SARS-CoV-2 nucleocapsid-specific antibodies.
- Data Analysis: a. Define the cell culture result as the reference method for the presence of infectious virus. b. Calculate PPA: (Number of Ag-RDT Positive samples that are culture positive) / (Total number of culture positive samples) x 100. c. Calculate NPA: (Number of Ag-RDT Negative samples that are culture negative) / (Total number of culture negative samples) x 100. d. Perform statistical analysis (e.g., 95% confidence intervals) for agreement metrics.
Protocol 3.2: Assessing Ag-RDT Limit of Detection (LOD) Relative to Culturable Virus
Objective: To establish the analytic sensitivity of the Ag-RDT in terms of the minimum culturable virus titer it can detect.
Methodology:
- Virus Stock Titration: Determine the tissue culture infectious dose 50% (TCID50/mL) of a well-characterized SARS-CoV-2 clinical isolate.
- Spike-and-Recovery: Serially dilute the virus stock in negative clinical matrix (e.g., pooled nasal swab VTM). Perform Ag-RDT testing in replicate (n≥20) at each dilution.
- Parallel Culture: Inoculate cell cultures with the same serial dilutions to confirm the presence of culturable virus at each dilution.
- LOD Determination: The Ag-RDT LOD is the lowest virus concentration (expressed as TCID50/mL) where ≥95% of replicates test positive, which must also be a concentration at which virus is consistently culturable.
Diagrams
Title: Correlation Study Workflow: Ag-RDT vs. Culture
Title: Public Health Decision Logic Based on Culture Correlation
The Scientist's Toolkit: Research Reagent Solutions
Table 3: Essential Materials for Culture-Correlation Studies
| Item | Function in Experiment | Key Considerations |
|---|---|---|
| Vero E6 Cells (ATCC CRL-1586) | Permissive cell line for SARS-CoV-2 isolation and culture. | Use low-passage cells. Can use engineered variants (e.g., expressing TMPRSS2) for enhanced sensitivity. |
| Viral Transport Media (VTM) | Preserves specimen integrity during transport for both Ag-RDT and culture. | Must be validated to not interfere with the specific Ag-RDT. |
| Reference SARS-CoV-2 Strain | Positive control for culture experiments. | Use a clinical isolate from an early passage, with known TCID50 and genome sequence. Follow BSL-3 protocols. |
| SARS-CoV-2 Nucleocapsid Antibody | For confirming viral presence in cell culture via immunofluorescence. | Critical for specific identification of CPE as SARS-CoV-2. |
| Cell Culture Media & Reagents | Supports growth and maintenance of Vero E6 cells. | Include fetal bovine serum (FBS), antibiotics, and trypsin. |
| Commercial Ag-RDT Kits | The test device under evaluation. | Source multiple lots for robustness testing. Follow IFU precisely. |
| RT-PCR Assay Kit | Quantifies viral RNA load (Ct value) from the same sample. | Enables correlation between Ag-RDT result, culture, and viral load. |
Conclusion
The correlation between SARS-CoV-2 Ag-RDT results and positive viral culture is a crucial metric, positioning Ag-RDTs not merely as detection tools but as potential indicators of transmission risk. Synthesizing the four intents reveals that while a strong correlation exists, especially during peak viral shedding, it is influenced by virological dynamics, methodological rigor, and emerging variants. For researchers and developers, this underscores the need for ongoing correlation studies with new variants and assays, integration of multi-parametric data (antigen, RNA, sequence), and refinement of Ag-RDTs to better serve as proxies for infectivity. Future directions include developing quantitative Ag-RDTs, establishing standardized correlation protocols for regulatory approval, and applying these insights to the next generation of rapid diagnostics for pandemic preparedness.