Quantifying Viral Load: A Complete Guide to RNA Isolation and RT-qPCR for Viral Genome Equivalents
This article provides a comprehensive, current guide for researchers and drug development professionals on accurately quantifying viral genomes using RNA isolation and RT-qPCR.
Quantifying Viral Load: A Complete Guide to RNA Isolation and RT-qPCR for Viral Genome Equivalents
Abstract
This article provides a comprehensive, current guide for researchers and drug development professionals on accurately quantifying viral genomes using RNA isolation and RT-qPCR. We explore the foundational principles of viral RNA quantification, detail optimized, step-by-step methodological protocols for diverse sample types, address common troubleshooting and optimization challenges, and critically compare validation strategies and emerging technologies. This guide aims to empower scientists with the knowledge to generate robust, reproducible viral load data essential for pathogenesis studies, therapeutic efficacy evaluation, and diagnostic development.
Viral RNA Quantification: Understanding the 'Why' and 'How' of Genome Equivalent Measurement
Within the context of RNA isolation and RT-qPCR research, a Viral Genome Equivalent (vge) is a standardized unit representing a single copy of the viral genome, regardless of its infectious potential. It is a molecular quantification of the physical number of viral nucleic acid molecules present in a sample. This is distinct from plaque-forming units (PFU) or tissue culture infectious dose (TCID₅₀), which measure infectious virions. The vge is a critical metric for quantifying both replicating virus and defective or non-infectious particles, providing a more comprehensive view of total viral burden.
Why Viral Genome Equivalents Matter
Quantifying vge is fundamental to modern virology and antiviral development. It matters because:
- Direct Molecular Quantification: It allows for the absolute quantification of viral load directly from clinical or research samples via RT-qPCR, bypassing the need for cell culture, which is slow and not possible for all viruses.
- Correlation with Disease Progression: In many viral infections (e.g., HIV, HCV, SARS-CoV-2), vge/mL in plasma or respiratory samples is a key prognostic marker and tracks treatment efficacy.
- Drug & Vaccine Development: It is the primary endpoint for evaluating antiviral drug potency (e.g., determining log₁₀ reduction in vge) and vaccine immunogenicity in challenge models.
- Understanding Viral Dynamics: Distinguishing between infectious titer and total genome copies reveals aspects of viral replication efficiency, defectiveness, and host immune response.
Quantitative Data: Key Comparisons
Table 1: Comparison of Viral Quantification Methods
| Parameter | Viral Genome Equivalents (vge) | Plaque Assay (PFU) | TCID₅₀ |
|---|---|---|---|
| What is Measured | Physical nucleic acid copies | Infectious virions forming plaques | Infectious virions causing cytopathic effect |
| Assay Principle | Molecular (RT-qPCR/dPCR) | Cell culture-based | Cell culture-based |
| Time to Result | Hours to 1 day | 3-14 days | 3-7 days |
| Precision | High (low CV%) | Moderate (subject to plating variability) | Moderate (endpoint dilution variability) |
| Information Gained | Total viral genomes (infectious + defective) | Quantity of infectious virus only | Quantity of infectious virus only |
| Ratio (vge:PFU) | Often 10:1 to 1000:1 (virus-dependent) | 1 (by definition) | Not directly comparable |
Table 2: Example RT-qPCR Results for VGE Quantification (Hypothetical SARS-CoV-2 Study)
| Sample | Mean Cq Value | Calculated vge/mL | Log₁₀ vge/mL | PFU/mL | vge:PFU Ratio |
|---|---|---|---|---|---|
| Patient A, Day 5 | 22.3 | 1.2 x 10⁷ | 7.08 | 5.0 x 10⁵ | 24:1 |
| Patient A, Day 10 | 30.1 | 8.5 x 10³ | 3.93 | ND | N/A |
| Cell Culture Supernatant | 18.5 | 3.0 x 10⁹ | 9.48 | 2.0 x 10⁸ | 15:1 |
| NTC | Undetected | 0 | 0 | 0 | N/A |
Cq: Quantification cycle; ND: Not Detected; NTC: No Template Control.
Experimental Protocols
Protocol 1: Absolute Quantification of Viral Genome Equivalents by RT-qPCR
Objective: To determine the absolute concentration of viral RNA genomes in a sample using an in vitro transcribed (IVT) RNA standard curve.
I. Generation of Quantification Standard
- Clone a DNA Template: Clone a 100-200 bp fragment of the target viral gene (e.g., N gene for SARS-CoV-2) into a plasmid vector with a T7 promoter.
- In Vitro Transcription (IVT): Linearize the plasmid downstream of the insert. Use a T7 RNA polymerase kit to synthesize RNA from the template. Include a 5' cap analog if needed.
- DNase Treatment: Treat the reaction with DNase I to remove template DNA.
- Purification & Quantification: Purify the IVT RNA using a silica-membrane column. Measure concentration by UV spectrophotometry (A260).
- Calculate Copy Number: Use the formula: Copies/µL = [RNA concentration (g/µL) x 6.022 x 10²³] / [Transcript length (nt) x 340 (g/mol/nt) x 1 x 10⁹].
- Prepare Standard Curve: Perform 10-fold serial dilutions (e.g., from 10⁹ to 10¹ copies/µL) in nuclease-free water containing carrier RNA (e.g., 1 µg/µL yeast tRNA) to stabilize dilute standards.
II. Sample RNA Isolation & RT-qPCR
- Viral RNA Isolation: Using a silica-membrane spin column kit, extract RNA from 140 µL of sample (viral transport media, serum, cell culture supernatant). Include appropriate negative extraction controls. Elute in 60 µL of nuclease-free water.
- Reverse Transcription: Use 5-10 µL of isolated RNA in a 20 µL RT reaction with random hexamers and a reverse transcriptase with high sensitivity and fidelity.
- qPCR Setup: Prepare a master mix containing hot-start DNA polymerase, dNTPs, MgCl₂, and sequence-specific primers/probe. Aliquot standard curve dilutions and unknown cDNA samples in triplicate.
- Run & Analyze: Perform qPCR. The software plots Cq vs. log₁₀ standard copy number to generate a linear regression curve. Use this equation to calculate the vge in the cDNA reaction, then back-calculate to vge per mL of original sample, accounting for all dilution and extraction volumes.
Protocol 2: Determining the vge:PFU Ratio
Objective: To correlate molecular (vge) and infectious (PFU) titers from the same sample.
- Split Sample: Aliquot a well-mixed viral sample (e.g., cell culture supernatant) into two equal parts.
- Part A - VGE by RT-qPCR: Process one part immediately through Protocol 1.
- Part B - PFU by Plaque Assay:
- Prepare 10-fold serial dilutions of the virus in infection medium.
- Inoculate confluent monolayers of permissive cells in 6-well plates with each dilution. Adsorb for 1 hour with gentle rocking.
- Overlay cells with a semi-solid medium (e.g., agarose or methylcellulose) to restrict viral spread to neighboring cells.
- Incubate for the appropriate time until plaques become visible.
- Fix cells with formaldehyde and stain with crystal violet. Count distinct plaques.
- Calculate PFU/mL: PFU/mL = (Number of plaques) / (Dilution factor x Inoculum volume (mL)).
- Calculate Ratio: Compute the vge:PFU ratio = (vge/mL) / (PFU/mL).
Visualization: Workflows and Relationships
Diagram 1: VGE Quantification Workflow
Diagram 2: VGE vs. Infectious Titer Relationship
The Scientist's Toolkit: Research Reagent Solutions
Table 3: Essential Materials for VGE Research
| Item | Function & Rationale |
|---|---|
| Silica-Membrane RNA Spin Columns | Rapid, efficient purification of viral RNA from complex biological samples, removing PCR inhibitors. |
| In Vitro Transcription Kit (T7) | Generates high-yield, pure RNA transcripts for creating the absolute quantification standard curve. |
| Reverse Transcriptase (High-Sensitivity) | Converts labile viral RNA into stable cDNA with high efficiency, critical for detecting low-copy targets. |
| Hot-Start qPCR Master Mix | Contains polymerase, dNTPs, Mg²⁺, and optimized buffer. Hot-start technology prevents non-specific amplification, improving sensitivity and specificity. |
| Sequence-Specific Primer/Probe Set | Oligonucleotides designed against a conserved region of the viral genome. The probe, with a fluorophore/quencher, enables specific, real-time detection. |
| Nuclease-Free Water & Tubes | Prevents degradation of RNA and oligonucleotides during sample and reaction preparation. |
| Carrier RNA (e.g., Yeast tRNA) | Added to dilution buffers for RNA standards to prevent adsorption to tube walls, improving accuracy of serial dilutions. |
| Digital PCR System (Alternative) | Provides absolute quantification without a standard curve by partitioning samples, offering superior precision for low vge measurements. |
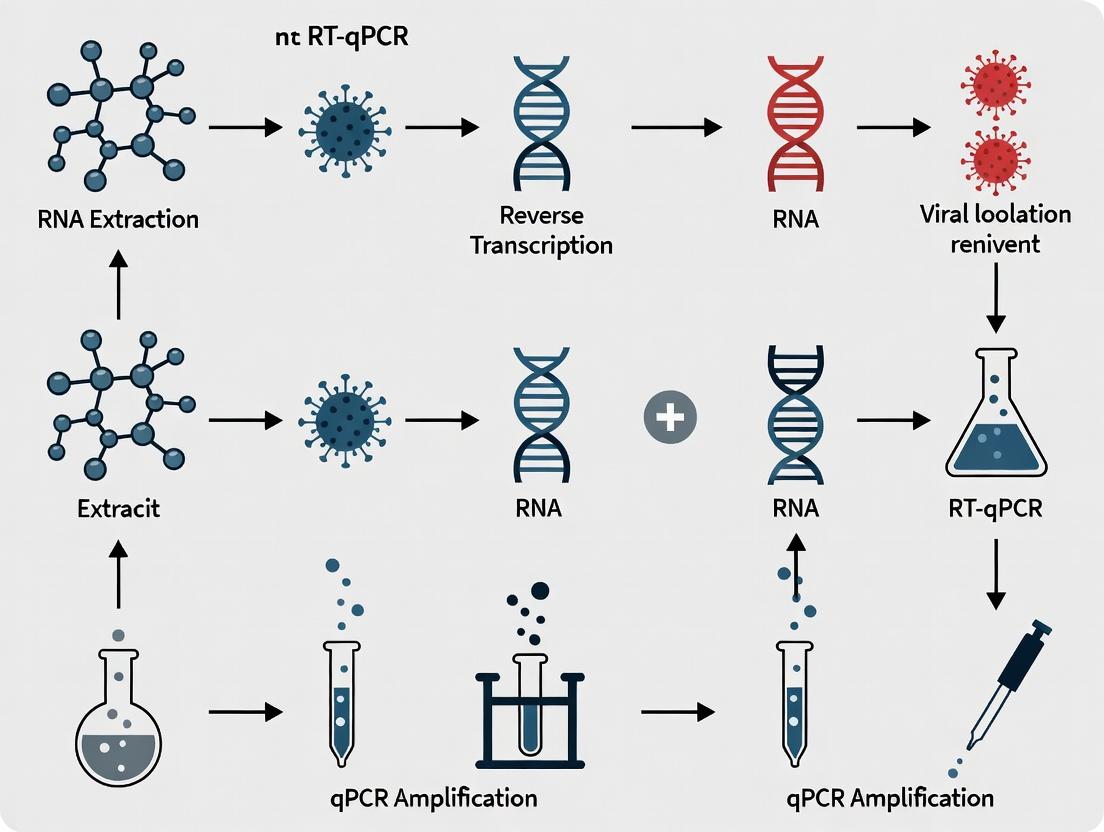
Within the broader thesis on RNA isolation and RT-qPCR for viral genome equivalents research, this application note details the critical workflow for quantifying viral RNA. The process mirrors the central dogma of molecular biology—from genomic viral RNA to complementary DNA (cDNA) via reverse transcription, followed by quantitative PCR (qPCR) amplification—enabling precise measurement of viral load, a cornerstone of pathogenesis studies, vaccine efficacy testing, and antiviral drug development.
Key Workflow and Signaling Pathway
Diagram: Viral RNA Quantification Workflow
Diagram: RT-qPCR Molecular Pathway
Research Reagent Solutions Toolkit
| Reagent / Material | Function in Viral RNA to cDNA to Quantification |
|---|---|
| Viral Transport Media (VTM) | Stabilizes viral particles in clinical samples prior to RNA isolation. |
| Silica-Membrane Spin Columns | Binds RNA selectively during purification, allowing contaminants to wash away. |
| RNase Inhibitors | Protects the often low-abundance viral RNA from degradation during processing. |
| Reverse Transcriptase (e.g., M-MLV, HiScript) | RNA-dependent DNA polymerase that synthesizes cDNA from the viral RNA template. |
| Sequence-Specific Primers / Oligo(dT) / Random Hexamers | Initiates cDNA synthesis by annealing to viral RNA or poly-A tail (if present). |
| dNTP Mix | Provides the nucleotide building blocks (dATP, dCTP, dGTP, dTTP) for cDNA and DNA synthesis. |
| Hot-Start DNA Polymerase (e.g., Taq) | Prevents non-specific amplification during qPCR setup; catalyzes DNA strand elongation. |
| Fluorescent Probe (e.g., TaqMan) or DNA-Binding Dye (SYBR Green) | Enables real-time detection of amplified PCR product. Probes offer higher specificity. |
| Quantitative Standard (DNA Plasmid or RNA Transcript) | A known-copy number standard for generating a calibration curve to calculate absolute viral genome equivalents. |
| Nuclease-Free Water & Plasticware | Ensures reactions are not compromised by environmental RNases or DNases. |
Detailed Experimental Protocols
Protocol 1: Viral RNA Isolation (Magnetic Bead-Based)
Principle: Viral particles are lysed, and RNA is bound to magnetic silica beads in high chaotropic salt, washed, and eluted in a low-ionic-strength solution.
Procedure:
- Lysis: Mix 200 µL of viral sample (e.g., cell culture supernatant, VTM) with 300 µL of Lysis/Binding Buffer (containing guanidine thiocyanate and β-mercaptoethanol). Vortex thoroughly.
- Binding: Add 50 µL of pre-washed magnetic silica beads. Incubate at room temperature for 5 minutes with gentle mixing.
- Capture: Place tube on a magnetic stand for 2 minutes until the solution clears. Carefully aspirate and discard supernatant.
- Wash:
- Wash 1: With tube on magnet, add 500 µL of Wash Buffer 1 (high salt). Resuspend beads off the magnet, then recapture. Remove supernatant.
- Wash 2: Repeat with 500 µL of Wash Buffer 2 (low salt/ethanol).
- Dry: Air-dry bead pellet for 5 minutes on magnet with lid open.
- Elution: Remove tube from magnet. Add 30-50 µL of Nuclease-Free Water or TE Buffer. Resuspend beads and incubate at 55°C for 2 minutes. Recapture beads and transfer the eluted RNA to a fresh tube.
- Storage: Quantify RNA (A260/A280) and store at -80°C if not used immediately for RT.
Protocol 2: Reverse Transcription for cDNA Synthesis
Principle: Using reverse transcriptase and primers, single-stranded cDNA is synthesized complementary to the viral RNA template.
Procedure (20 µL Reaction):
- Prepare RT Mix on ice:
- Viral RNA template: 1-10 µL (up to 1 µg total RNA)
- Primer: 1 µL (50 µM Oligo(dT), 2 µM gene-specific, or 50 ng Random Hexamers)
- dNTP Mix (10 mM each): 1 µL
- Nuclease-Free Water to 12 µL total.
- Denature: Heat mixture to 65°C for 5 minutes, then immediately place on ice for 2 minutes.
- Complete Master Mix: Add the following:
- 5X RT Buffer: 4 µL
- RNase Inhibitor (40 U/µL): 0.5 µL
- Reverse Transcriptase (200 U/µL): 1 µL
- Nuclease-Free Water: 2.5 µL
- Final Volume: 20 µL.
- Incubate:
- For Oligo(dT)/Gene-Specific: 50°C for 45 minutes.
- For Random Hexamers: 25°C for 10 minutes (annealing), then 50°C for 45 minutes.
- Inactivation: Heat to 85°C for 5 minutes. cDNA can be used directly in qPCR or stored at -20°C.
Protocol 3: Absolute Quantification by SYBR Green qPCR
Principle: Viral cDNA is amplified with sequence-specific primers. SYBR Green dye binds to double-stranded DNA, and fluorescence is measured each cycle. A standard curve from known copy numbers is used to determine the original viral RNA copy number.
Procedure:
- Prepare Standard Curve: Perform 10-fold serial dilutions (e.g., 10^7 to 10^1 copies/µL) of a quantified DNA plasmid containing the viral target sequence.
- Prepare qPCR Reaction Mix (20 µL):
- 2X SYBR Green Master Mix: 10 µL
- Forward Primer (10 µM): 0.8 µL
- Reverse Primer (10 µM): 0.8 µL
- Template (cDNA or standard): 2 µL
- Nuclease-Free Water: 6.4 µL
- Run qPCR Program:
- Step 1: Polymerase Activation/Hot Start: 95°C for 3 min.
- Step 2: 40 Cycles of:
- Denaturation: 95°C for 15 sec.
- Annealing/Extension: 60°C for 1 min (acquire fluorescence).
- Step 3: Melt Curve Analysis: 65°C to 95°C, increment 0.5°C every 5 sec.
- Analysis:
- The instrument software plots fluorescence (ΔRn) vs cycle, determining the Quantification Cycle (Cq) for each sample.
- Generate a standard curve by plotting the Cq values of the standards against the log10 of their known copy number.
- Use the linear regression equation from the standard curve to calculate the copy number in the unknown cDNA samples.
- Account for any dilution factors and the volume of RNA used in RT to report final Viral Genome Equivalents per mL of original sample.
Quantitative Data Presentation
Table 1: Representative Standard Curve Data for SARS-CoV-2 N Gene qPCR
| Standard Dilution | Known Copy Number (log10) | Mean Cq Value (n=3) | Standard Deviation (Cq) |
|---|---|---|---|
| Undiluted Plasmid | 7.0 | 18.2 | 0.15 |
| 1:10 | 6.0 | 21.7 | 0.21 |
| 1:100 | 5.0 | 25.1 | 0.18 |
| 1:1,000 | 4.0 | 28.4 | 0.32 |
| 1:10,000 | 3.0 | 31.9 | 0.25 |
| 1:100,000 | 2.0 | 35.3 | 0.41 |
| NTC | 0 | Undetermined | - |
- Regression Equation: y = -3.42x + 40.11
- Efficiency (E): 96.1% (Calculated as E = [10^(-1/slope)] - 1)
- R²: 0.999
Table 2: Calculated Viral Load from Clinical Sample Analysis
| Sample ID | Target Gene | Cq Value | Calculated cDNA Copy Number (log10) | Viral Load (Genome Eq./mL of VTM)* | Interpretation |
|---|---|---|---|---|---|
| PT-001 | SARS-CoV-2 (N) | 22.5 | 5.15 | 2.2 x 10^6 | High |
| PT-002 | SARS-CoV-2 (N) | 30.1 | 2.92 | 1.3 x 10^4 | Moderate |
| PT-003 | SARS-CoV-2 (N) | 36.8 | 0.96 | 1.1 x 10^3 | Low |
| PT-004 (Control) | SARS-CoV-2 (N) | Undetected | 0 | < 5.0 x 10^2 | Negative |
Calculation Note: Assumes 5 µL of RNA from 200 µL VTM was used in RT, followed by 2 µL of 20 µL cDNA used in qPCR. Calculation: (10^(cDNA log10)) x (20/2) x (200/5) = Genome Eq./mL.
Within the context of a broader thesis on quantifying viral genome equivalents, RT-qPCR stands as the indispensable gold standard. This technique combines the reverse transcription (RT) of RNA into complementary DNA (cDNA) with the quantitative real-time polymerase chain reaction (qPCR), enabling the sensitive, specific, and absolute quantification of viral RNA targets. The accuracy of this method is foundational for viral load determination, vaccine development, and antiviral drug efficacy studies.
Principles of Reverse Transcription
Reverse transcription is the enzymatic synthesis of a cDNA strand from an RNA template, catalyzed by reverse transcriptase. Key considerations include:
- Priming Strategy: Oligo(dT) primers (for polyadenylated mRNA), gene-specific primers (for maximum specificity), or random hexamers (for complex RNA or fragmented RNA) are used to initiate cDNA synthesis.
- Enzyme Selection: Modern reverse transcriptases are engineered for high thermal stability and fidelity, allowing efficient cDNA synthesis at elevated temperatures to minimize secondary RNA structure.
Principles of Real-Time Amplification
Real-time PCR monitors the accumulation of amplified DNA product during each cycle of the PCR reaction using fluorescent reporting systems.
- Detection Chemistry: Two primary chemistries are employed:
- DNA-Binding Dyes (e.g., SYBR Green): Intercalate non-specifically into double-stranded DNA, offering simplicity and cost-effectiveness but requiring post-amplification melt curve analysis for specificity confirmation.
- Sequence-Specific Probes (e.g., TaqMan, Molecular Beacons): Provide higher specificity through an oligonucleotide probe labeled with a fluorophore and a quencher. The 5'→3' exonuclease activity of Taq polymerase cleaves the probe during amplification, separating the fluorophore from the quencher and generating a fluorescent signal proportional to the amplicon yield.
Table 1: Comparison of Common Real-Time Detection Chemistries
| Chemistry | Probe/Dye | Specificity | Multiplexing Capability | Relative Cost | Primary Use Case |
|---|---|---|---|---|---|
| DNA-Binding Dye | SYBR Green I | Low (binds all dsDNA) | Low (single-plex) | Low | Gene expression screening, target validation |
| Hydrolysis Probe | TaqMan (Dual-labeled) | Very High | High | High | Absolute quantification, viral load, multiplex assays |
| Hybridization Probe | Molecular Beacon | High | High | High | SNP genotyping, pathogen detection |
Application Notes for Viral Genome Equivalent Quantification
- Standard Curve Absolute Quantification: A dilution series of a synthetic RNA standard or a plasmid containing the target sequence with known copy number is run concurrently with samples. The cycle threshold (Ct) values of the standards are plotted against the logarithm of their initial copy number to generate a standard curve. The copy number in unknown samples is extrapolated from this curve.
- Inhibition Controls: The inclusion of an internal positive control (IPC) is critical to detect PCR inhibitors co-purified during RNA isolation from complex biological samples.
- Single-Copy Sensitivity: Optimized assays can reliably detect down to a single copy of viral RNA per reaction, essential for monitoring low-level viremia or early infection.
Detailed Protocols
Protocol 1: Two-Step RT-qPCR for Absolute Viral RNA Quantification
Principle: The reverse transcription and PCR amplification are performed in separate, sequential reactions. This allows for archiving cDNA and testing multiple targets from a single RT reaction. Materials: See "The Scientist's Toolkit" below. Procedure:
- RNA Isolation: Purify total RNA from viral culture or infected tissue/cells using a silica-membrane column kit with on-column DNase I treatment. Elute in RNase-free water. Quantify purity (A260/A280 ~2.0-2.2).
- Reverse Transcription (20 µL reaction):
- Combine in a nuclease-free tube: 1-1000 ng total RNA, 1 µL Oligo(dT)18/Gene-Specific Primer/Random Hexamer mix (100 µM), and RNase-free water to 12 µL.
- Heat mixture to 65°C for 5 min, then immediately chill on ice.
- Add: 4 µL 5x Reaction Buffer, 1 µL Ribolock RNase Inhibitor (20 U), 2 µL 10mM dNTP Mix, and 1 µL Reverse Transcriptase (200 U/µL).
- Incubate: 25°C for 5 min (primer annealing), 42-55°C for 30-60 min (extension), 70°C for 5 min (enzyme inactivation). Hold at 4°C.
- Real-Time qPCR Setup (20 µL reaction in a 96-well plate):
- Prepare a master mix per sample: 10 µL 2x TaqMan Universal Master Mix, 1 µL 20x Target Primer-Probe Mix, 4 µL Nuclease-free water.
- Aliquot 15 µL of master mix into each well. Add 5 µL of cDNA (from step 2; dilute if necessary). Include no-template controls (NTC) and standard curve dilutions in duplicate.
- Seal plate, centrifuge briefly.
- Run on Real-Time PCR System with cycling conditions: 95°C for 10 min (polymerase activation); 40 cycles of 95°C for 15 sec (denaturation) and 60°C for 1 min (annealing/extension/data acquisition).
Protocol 2: One-Step RT-qPCR for High-Throughput Viral Detection
Principle: Reverse transcription and PCR are combined in a single tube and buffer, minimizing hands-on time and cross-contamination risk. Ideal for diagnostic screening. Procedure:
- Reaction Setup (20 µL reaction):
- Combine in each well: 5 µL of isolated RNA, 10 µL 2x One-Step RT-PCR Master Mix (contains buffer, dNTPs, enzyme mix), 1 µL 20x Primer-Probe Mix, 4 µL Nuclease-free water.
- Include NTCs and a positive control.
- Thermal Cycling: Use instrument parameters that combine reverse transcription (e.g., 50°C for 10-15 min), RT inactivation/polymerase activation (95°C for 2-10 min), followed by 40-45 cycles of denaturation and annealing/extension as in Protocol 1.
Table 2: Key Parameters for Optimized Viral RT-qPCR Assay Validation
| Parameter | Target Value/Outcome | Method of Assessment | Importance for Viral Quantification |
|---|---|---|---|
| Amplification Efficiency (E) | 90-110% (Slope -3.1 to -3.6) | Standard curve slope | Ensures accurate extrapolation of copy number. |
| Coefficient of Determination (R²) | >0.990 | Standard curve linear regression | Indicates reliability of the standard curve. |
| Limit of Detection (LoD) | ≤10 copies/reaction | Probit analysis on dilution series | Defines the lowest measurable viral load. |
| Dynamic Range | ≥6-8 log10 units | Serial dilution of standard | Allows quantification across clinical sample variability. |
| Intra-/Inter-assay CV | <5% / <10% | Replicate Ct values | Demonstrates assay precision and reproducibility. |
Visualization of Workflows and Principles
Title: Two-Step RT-qPCR Workflow for Viral RNA
Title: TaqMan Probe Hydrolysis Mechanism
Title: Viral Genome Quantification Thesis Workflow
The Scientist's Toolkit: Essential Research Reagent Solutions
| Item | Function & Rationale |
|---|---|
| Silica-Membrane RNA Isolation Kit | Selective binding of RNA in high-salt conditions, followed by washing and elution in low-ionic-strength solution. Provides high-purity, inhibitor-free RNA essential for sensitive RT-qPCR. |
| DNase I, RNase-free | Degrades contaminating genomic DNA during or after RNA purification to prevent false-positive amplification signals. |
| Reverse Transcriptase (e.g., M-MuLV, engineered variants) | Catalyzes the synthesis of first-strand cDNA from RNA template. High-temperature variants improve yield from structured viral RNA genomes. |
| Ribolock RNase Inhibitor | Protects RNA templates and cDNA products from degradation by ubiquitous RNases, ensuring assay reproducibility. |
| dNTP Mix (10mM each) | Provides the deoxyribonucleotide triphosphate building blocks (dATP, dCTP, dGTP, dTTP) for cDNA synthesis and PCR amplification. |
| TaqMan Universal Master Mix II, with UNG | Contains hot-start Taq DNA polymerase, dNTPs, buffers, and Uracil-N-Glycosylase (UNG). UNG prevents carryover contamination by degrading previous PCR products containing dUTP. |
| One-Step RT-qPCR Master Mix | Optimized single-tube formulation containing reverse transcriptase, hot-start Taq polymerase, dNTPs, and buffer. Streamlines workflow for high-throughput applications. |
| Target-Specific Primer-Probe Set (20x) | Pre-optimized, lyophilized oligonucleotides for specific viral target. Contains forward primer, reverse primer, and a dual-labeled hydrolysis probe (FAM/TAMRA or other dyes). |
| Quantitative Synthetic RNA Standard | In vitro transcribed RNA of known concentration, containing the target sequence. Crucial for generating the standard curve for absolute quantification of viral copy number. |
| Nuclease-Free Water | Certified free of RNases, DNases, and PCR inhibitors. Used for all reaction setups and dilutions to prevent enzymatic degradation and assay interference. |
Within RNA isolation and RT-qPCR research for quantifying viral genome equivalents, the initial sample type is the primary determinant of protocol design. Swabs, serum, and tissue each present unique matrices, challenges, and concentrations of target analyte, directly influencing every subsequent step from collection to data analysis. This application note details the considerations and methodologies optimized for each sample type to ensure accurate, reproducible viral load data.
Comparative Analysis of Sample Types
The physical and biochemical characteristics of the sample dictate specific pre-analytical and analytical handling.
Table 1: Characteristics and Challenges of Different Sample Types for Viral RNA Analysis
| Sample Type | Typical Viral Targets | Key Advantages | Primary Challenges | Typical Yield of Total RNA | Inhibitor Concerns |
|---|---|---|---|---|---|
| Swab (Nasal/Oropharyngeal) | Respiratory viruses (e.g., SARS-CoV-2, Influenza), HPV | Minimally invasive, standard for respiratory pathogens. | Low viral load, variable collection, mucins/cellular debris. | 0.1 - 2 µg | High (Mucins, salts, proteins) |
| Serum/Plasma | Viremic agents (e.g., HIV, HCV, Dengue, CMV), BKV | Represents systemic infection, cell-free virus. | Very low RNA concentration, high nuclease activity. | < 0.1 µg | Medium (Hemoglobin, immunoglobulins, lipids) |
| Tissue (e.g., Lung, Liver) | Tissue-tropic viruses (e.g., HSV, SARS-CoV-2, Zika) | Localized viral replication, high pathological relevance. | Complex homogenization, high RNase activity, abundant host RNA. | 1 - 20 µg | High (RNases, complex organics) |
Detailed Protocols for Sample-Specific RNA Isolation
Protocol 2.1: RNA Isolation from Viral Transport Media (VTM) Swabs
Objective: To isolate viral RNA from nasopharyngeal swabs in VTM, overcoming PCR inhibitors. Reagent Solutions: Proteinase K (digests nucleoproteins and inactivates RNases), Carrier RNA (enhances binding of low-concentration viral RNA to silica membranes), Inhibition-Resistant RT-qPCR Master Mix (contains inhibitors of inhibitor-resistant enzymes).
- Sample Pre-treatment: Vortex VTM sample vigorously for 15s. Transfer 200 µL to a nuclease-free tube.
- Lysis: Add 200 µL of lysis buffer (containing Guanidine Thiocyanate) and 20 µL of Proteinase K. Vortex for 15s. Incubate at 56°C for 15 minutes.
- Binding: Add 250 µL of 100% ethanol and the provided carrier RNA. Mix by pipetting. Transfer the entire mixture to a silica spin column.
- Wash: Centrifuge. Wash twice with wash buffer (containing ethanol).
- Elution: Perform an on-column DNase I digest (15 min, RT). Perform two final wash steps. Elute RNA in 50-60 µL of nuclease-free water. Store at -80°C.
Protocol 2.2: RNA Isolation from Serum/Plasma
Objective: To concentrate and purify low-abundance, cell-free viral RNA from a large serum volume. Reagent Solutions: Glycogen (acts as an inert co-precipitant to visualize RNA pellet), RNase Inhibitor (added to elution buffer to protect purified RNA), High-Volume Binding Columns.
- Virus Concentration: Start with 500 µL - 1 mL of serum/plasma. Add 3x volume of TRIzol LS reagent. Vortex vigorously. Incubate 5 min at RT.
- Phase Separation: Add 200 µL chloroform per 1 mL TRIzol LS used. Shake vigorously, incubate 3 min. Centrifuge at 12,000 x g, 15 min, 4°C.
- RNA Precipitation: Transfer aqueous phase to a new tube. Add 2 µL glycogen (20 mg/mL) and 1x volume isopropanol. Mix. Incubate at -20°C for 1 hour.
- Pellet and Wash: Centrifuge at 12,000 x g, 30 min, 4°C. Wash pellet with 75% ethanol. Air-dry.
- Resuspension: Dissolve pellet in 20 µL nuclease-free water containing 1 U/µL RNase Inhibitor.
Protocol 2.3: RNA Isolation from Tissue
Objective: To homogenize tissue and extract RNA while fully inactivating endogenous RNases. Reagent Solutions: RNAlater (stabilization solution for tissue post-collection), Mechanical Homogenizer (Bead Mill or Rotor-Stator) (ensures complete tissue disruption), β-Mercaptoethanol (added to lysis buffer to denature RNases).
- Stabilization: Preserve tissue sample in RNAlater immediately upon collection. Store at -80°C.
- Homogenization: Weigh 20-30 mg of tissue. Place in a tube with 600 µL of RLT lysis buffer (+ 1% β-ME) and a stainless-steel bead. Homogenize in a bead mill for 2x2 min at 25 Hz. Place samples on ice.
- Clarification: Centrifuge lysate at 12,000 x g for 3 min. Transfer supernatant to a new tube.
- Purification: Add 1 volume of 70% ethanol. Mix. Proceed with silica-membrane column purification as per manufacturer's protocol, including on-column DNase digest.
- Elution: Elute in 30-50 µL water. Quantify by spectrophotometry.
Workflow and Logical Diagrams
Title: RNA Isolation Workflow for Different Sample Types
Title: Protocol Design Logic Based on Sample Inhibitors
The Scientist's Toolkit: Essential Research Reagent Solutions
Table 2: Key Reagents for Viral RNA Isolation and Their Functions
| Reagent/Solution | Primary Function | Critical Application Note |
|---|---|---|
| Chaotropic Lysis Buffer (e.g., Guanidine salts) | Denatures proteins, inactivates RNases, releases nucleic acids. | Universal first step; concentration may vary by sample type. |
| Proteinase K | Broad-spectrum protease digests proteins and nucleases. | Essential for swabs/tissue to degrade mucins/cellular structures. |
| Carrier RNA (e.g., Poly-A, tRNA) | Improves binding efficiency of low-concentration viral RNA to silica. | Critical for low-yield samples (swabs, serum). |
| RNase Inhibitor | Non-competitive protein that binds and inhibits RNases. | Add to elution buffer for serum/tissue RNA for long-term stability. |
| DNase I (RNase-free) | Degrades genomic DNA contamination. | Mandatory on-column step for tissue; recommended for swabs. |
| Inhibition-Resistant Polymerase | Engineered enzyme resistant to common biological inhibitors. | Use in RT-qPCR for complex samples (swabs, tissue) without dilution. |
| RNAlater | Tissue storage reagent that permeates and stabilizes RNA. | Prevents RNA degradation in tissue between collection and processing. |
| β-Mercaptoethanol | Reducing agent that denatures RNases by breaking disulfide bonds. | Must be added fresh to lysis buffer for tissue samples. |
Application Notes: Context within Viral Genome Equivalents Research
In viral research, quantifying genome equivalents (GE) per unit volume (e.g., in patient swabs, culture supernatants, or vaccine formulations) is critical for assessing viral load, replication kinetics, and therapeutic efficacy. Reverse Transcription Quantitative PCR (RT-qPCR) is the cornerstone technique. The choice of quantification standard—synthetic in vitro transcribed (IVT) RNA versus plasmid DNA (pDNA)—fundamentally impacts the accuracy, relevance, and interpretation of GE data. This decision must align with the experimental question and account for the entire workflow from isolation to detection.
| Quantification Standard Comparison | ||
|---|---|---|
| Parameter | In vitro Transcribed (IVT) RNA Standard | Plasmid DNA (pDNA) Standard |
| Molecular Form | Single-stranded RNA, identical to target viral genomic or subgenomic RNA. | Double-stranded DNA containing the viral target amplicon sequence. |
| Process Coverage | Mimics the entire RT-qPCR process: reverse transcription efficiency and PCR efficiency. | Controls only for PCR amplification efficiency; does not account for RT efficiency. |
| Accuracy for GE | High. Directly correlates output Cq to known copies of RNA molecules, providing a true measure of detectable RNA genomes. | Potentially Overestimates. Measures DNA amplicon copies; assumes 100% RT efficiency, leading to underestimation of required RNA input copies. |
| Stability & Handling | Labile. Susceptible to RNase degradation; requires strict handling, aliquoting, and storage at -80°C. | Stable. Resistant to degradation; easier to handle, quantify, and store at -20°C. |
| Preparation Complexity | High. Requires linearized plasmid template, in vitro transcription kit, DNase treatment, purification, and accurate quantification (e.g., fluorometry). | Low. Requires plasmid propagation, purification, linearization (optional), and standard spectrophotometry/fluorometry. |
| Primary Application | Absolute Quantification of viral RNA where precise GE/ml is required (e.g., viral load standards, vaccine potency). | Relative Quantification (e.g., fold-change vs. control) or absolute quantification where a rough estimate is acceptable. |
Detailed Experimental Protocols
Protocol 1: Generating and Using IVT RNA Standards for Absolute Quantification
Objective: To create a serial dilution of IVT RNA with known copy numbers for absolute quantification of viral GE in clinical samples.
Materials (Research Reagent Solutions Toolkit):
| Reagent/Material | Function |
|---|---|
| Linearized Plasmid DNA Template | Contains viral target sequence downstream of a bacteriophage promoter (e.g., T7, SP6). |
| In Vitro Transcription Kit (e.g., MEGAscript) | Provides optimized buffers, RNase inhibitors, and enzymes for high-yield RNA synthesis. |
| DNase I (RNase-free) | Removes the DNA template post-transcription to prevent amplification bias. |
| RNA Clean-up Kit (e.g., silica-membrane based) | Purifies IVT RNA from reaction components and concentrates it. |
| Fluorescent RNA Binding Dye & Qubit Fluorometer | Critical. Accurately quantifies intact RNA without contamination from nucleotides or degraded RNA. |
| RT-qPCR Master Mix (One-Step or Two-Step) | Contains reverse transcriptase, hot-start Taq polymerase, dNTPs, buffer, and optional ROX dye. |
| Nuclease-free Water & Barrier Tips | Prevents RNase contamination throughout the workflow. |
Procedure:
- Linearize Template: Digest 5-10 µg of purified plasmid containing the target insert with a restriction enzyme downstream of the insert. Verify complete linearization by agarose gel electrophoresis.
- Purify & Quantify: Purify linearized DNA using a PCR clean-up kit. Quantify by UV spectrophotometry (A260).
- In Vitro Transcription: Assemble reaction per kit instructions using ~1 µg linearized template. Incubate at recommended temperature (e.g., 37°C for T7) for 2-4 hours.
- DNase Treatment: Add DNase I to the reaction mix and incubate for 15 min at 37°C to remove template DNA.
- RNA Purification: Purify the IVT RNA using an RNA clean-up kit. Elute in nuclease-free water.
- Quantification & Quality Control:
- Use a fluorometric RNA assay (e.g., Qubit RNA HS Assay) for accurate copy number determination. Calculate copies/µL:
Copies/µL = [Concentration (g/µL) / (Transcript Length x 660)] x 6.022x10^23. - Check integrity via microfluidic capillary electrophoresis (e.g., Bioanalyzer).
- Use a fluorometric RNA assay (e.g., Qubit RNA HS Assay) for accurate copy number determination. Calculate copies/µL:
- Standard Curve Preparation: Perform a 10-fold serial dilution (e.g., 10^7 to 10^1 copies/µL) in nuclease-free water containing carrier RNA (e.g., 10 ng/µL yeast tRNA) to stabilize dilute standards. Aliquot and store at -80°C.
- RT-qPCR Run: Include the dilution series in every run alongside unknown samples. Use a One-Step RT-qPCR protocol (reverse transcription and PCR in the same well) to most accurately reflect sample processing.
Protocol 2: Generating and Using Plasmid DNA Standards
Objective: To create a pDNA standard for relative quantification or semi-quantitative absolute estimation.
Materials (Research Reagent Solutions Toolkit):
| Reagent/Material | Function |
|---|---|
| High-Fidelity DNA Polymerase | Amplifies target insert from viral cDNA with minimal errors for cloning. |
| TA/Blunt-End Cloning Vector Kit | Provides linearized, ready-to-use vector and ligation reagents. |
| Competent E. coli Cells | For transformation and plasmid propagation. |
| Plasmid Miniprep & Midiprep Kits | For small- and large-scale isolation of high-purity plasmid DNA. |
| Spectrophotometer (NanoDrop) | For rapid quantification and purity check (A260/A280 ~1.8) of purified plasmid. |
| Restriction Enzyme or PCR Primers | For linearizing plasmid or re-amplifying the insert for standard curves. |
| SYBR Green or Probe-based qPCR Master Mix | For amplification and detection in the qPCR step. |
Procedure:
- Clone Target Sequence: Amplify the viral target region from cDNA. Clone into a standard plasmid vector per kit protocol. Verify sequence by Sanger sequencing.
- Propagate and Purify Plasmid: Isolate plasmid DNA from a transformed bacterial culture using a midiprep kit for high yield.
- Quantify & Calculate Copies: Quantify plasmid by UV spectrophotometry. Calculate copy number:
Copies/µL = [Concentration (g/µL) / (Plasmid Length in bp x 660)] x 6.022x10^23. - Standard Curve Preparation (Two Options):
- Option A (Linearized Plasmid): Linearize a portion of the plasmid with a single-cut restriction enzyme to mimic an amplicon. Purify and create serial dilutions.
- Option B (Intact Plasmid): Create serial dilutions directly from the circular plasmid. Note that supercoiled DNA may amplify with slightly different efficiency.
- RT-qPCR Run:
- For Two-Step RT-qPCR: First, reverse transcribe all RNA samples (unknowns and IVT standards if used) to cDNA in a separate reaction. Then, run the qPCR with pDNA standards and diluted cDNA samples.
- The pDNA standard curve only defines the PCR efficiency. The absolute copy number assigned to unknowns is extrapolated based on the assumption of 100% RT efficiency, which is a key source of potential error.
Visualizations
Title: Standard Selection Workflow for Viral RNA Quantification
Title: How Standards Calibrate the RT-qPCR Process
Step-by-Step Protocols: From Sample Lysis to CT Value for Accurate Viral Load Analysis
Within the framework of research on RNA isolation and RT-qPCR for quantifying viral genome equivalents, the initial phase of viral RNA isolation is a critical determinant of data integrity. The efficiency, purity, and consistency of RNA recovery directly impact downstream reverse transcription and amplification efficiencies. This application note provides a detailed comparison of three core methodologies—Spin Column, Magnetic Bead, and Automated Liquid Handling—to guide researchers and drug development professionals in selecting an optimal approach for their specific throughput, precision, and resource requirements.
Quantitative Comparison of Methods
Table 1: Method Comparison Based on Current Protocols and Performance Data
| Parameter | Spin Column | Magnetic Bead | Automated Liquid Handling (Bead-Based) |
|---|---|---|---|
| Typical Input Volume | 100-140 µL (viral transport media) | 100-1000 µL (flexible) | 200-1000 µL (multi-sample) |
| Average Yield | Moderate | High (esp. from large vols) | High & Consistent |
| Average A260/A280 Purity | 1.8-2.1 | 1.9-2.2 | 1.9-2.1 |
| Hands-on Time (per 12 samples) | ~60 minutes | ~45 minutes | ~15 minutes (set-up) |
| Total Processing Time (per 12 samples) | ~90 minutes | ~70 minutes | ~90 minutes |
| Throughput | Low to Medium | Medium | High (96-well format) |
| Initial Cost per Sample | Low | Medium | High (equipment) |
| Reproducibility (CV) | Moderate (~15-25%) | Good (~10-20%) | Excellent (<10%) |
| Suitability for High-Throughput | Limited | Good | Excellent |
| Primary Advantage | Low cost, widespread protocols | Scalable input, flexible | Walk-away automation, superior reproducibility |
Detailed Experimental Protocols
Protocol 3.1: Spin Column-Based RNA Isolation (From Viral Transport Media)
- Key Principle: RNA binding to a silica membrane in the presence of chaotropic salts, followed by washes and elution.
- Materials: Viral transport media sample, ethanol, wash buffers, RNase-free water, microcentrifuge, spin columns.
- Procedure:
- Add 1-5 volumes of lysis/binding buffer containing guanidine isothiocyanate to the sample. Mix thoroughly.
- Add 1 volume of 70% ethanol and mix by pipetting.
- Transfer the entire lysate to a spin column. Centrifuge at ≥10,000 x g for 30 seconds. Discard flow-through.
- Add Wash Buffer 1. Centrifuge for 30 seconds. Discard flow-through.
- Add Wash Buffer 2 (often containing ethanol). Centrifuge for 30 seconds. Discard flow-through.
- Perform a second wash with Wash Buffer 2. Centrifuge for 1 minute to dry membrane.
- Transfer column to a fresh collection tube. Elute RNA by adding 30-100 µL of RNase-free water or TE buffer directly to the membrane. Centrifuge for 1 minute.
Protocol 3.2: Magnetic Bead-Based RNA Isolation
- Key Principle: Selective binding of RNA to functionalized magnetic beads, separation via magnet, and elution.
- Materials: Viral sample, magnetic beads (e.g., silica-coated), 96-well deep-well plate, magnetic stand, ethanol, wash buffers.
- Procedure:
- Combine sample with lysis/binding buffer and magnetic beads in a tube/well. Incubate for 5 minutes with mixing to allow RNA binding.
- Place tube/plate on a magnetic stand. Wait until the solution clears (~2-5 minutes). Carefully discard the supernatant.
- Remove from magnet. Resuspend beads in Wash Buffer 1 by pipetting. Return to magnet, clear, and discard supernatant.
- Repeat step 3 with Wash Buffer 2.
- Perform a final 80% ethanol wash. After removing supernatant, air-dry beads for 5-10 minutes.
- Remove from magnet. Elute RNA by adding elution buffer, resuspending beads, and incubating at 55-65°C for 2-5 minutes.
- Return to magnet and transfer the clear eluate containing RNA to a fresh tube.
Protocol 3.3: Automated Liquid Handling Workflow
- Key Principle: Robotic execution of magnetic bead-based protocol with integrated heating/cooling and tip-changing.
- Materials: Automated liquid handler (e.g., Thermo Fisher KingFisher, Promega Maxwell, QIAGEN QIAcube), dedicated reagent cassettes, magnetic bead plates, elution plates.
- Procedure:
- Deck Setup: Load samples, tip boxes, and all necessary pre-dispensed reagent plates (lysis, beads, washes, elution) onto the instrument deck.
- Program Selection: Load the validated protocol specifying volumes, mixing steps, magnet engagement times, and transfer steps.
- Run Initiation: Start the run. The instrument automatically:
- Transfers samples to the processing plate.
- Adds lysis buffer and beads, mixing to bind RNA.
- Uses an internal magnet to capture beads while discarding waste.
- Performs sequential wash steps.
- Dries beads and elutes RNA into a final PCR-compatible plate.
- Recovery: Retrieve the sealed elution plate containing purified RNA, ready for downstream setup.
Visualized Workflows and Pathways
Spin Column RNA Isolation Workflow
Magnetic Bead RNA Isolation Workflow
Automated RNA Isolation Workflow
The Scientist's Toolkit: Key Research Reagent Solutions
Table 2: Essential Materials for Viral RNA Isolation
| Item | Function | Example/Critical Feature |
|---|---|---|
| Lysis/Binding Buffer | Disrupts viral envelope, inactivates RNases, and creates conditions for nucleic acid binding to silica. | Contains chaotropic salts (e.g., guanidine salts) and a detergent. |
| Silica Matrix | The solid phase that selectively binds RNA under high-salt conditions. | Silica membrane (spin columns) or silica-coated magnetic beads. |
| Wash Buffers | Removes contaminants (proteins, salts, inhibitors) while keeping RNA bound. | Typically an ethanol-containing buffer; may include a second wash with low salt. |
| Nuclease-Free Water | Elutes purified RNA from the silica matrix. | Certified RNase-free, low EDTA. Critical for downstream RT-qPCR. |
| Carrier RNA | Improves yield of low-concentration viral RNA by enhancing binding efficiency. | Often used in kits for respiratory viruses (e.g., SARS-CoV-2). |
| Proteinase K | Optional pre-lysis step to digest proteins and nucleoproteins, improving yield. | Useful for complex samples or certain enveloped viruses. |
| Magnetic Stand | For bead-based methods; separates beads from solution for supernatant removal. | 96-well format stands are essential for high-throughput processing. |
| Automated Liquid Handler | Robots that perform pipetting, mixing, and magnetic separation steps. | Integrated systems (e.g., KingFisher, Maxwell) ensure maximal reproducibility. |
Within the broader thesis on quantifying viral genome equivalents via RT-qPCR, the paramount challenge is obtaining inhibitor-free RNA from complex biological matrices. Samples like sputum and stool contain polysaccharides, bile salts, humic acids, and complex proteins that co-purify with nucleic acids and potently inhibit downstream reverse transcription and polymerase activity. This application note details current, effective techniques for overcoming this bottleneck, ensuring accurate viral load quantification essential for pathogenesis studies, drug efficacy trials, and vaccine development.
Key Inhibitor Removal Techniques: Comparison & Data
The efficacy of various methods is quantified by metrics such as RNA yield, purity (A260/A280 & A260/A230 ratios), and the absence of inhibition as measured by RT-qPCR cycle threshold (Ct) shifts using an internal control.
Table 1: Comparison of Primary Inhibitor Removal Techniques
| Technique | Principle | Best Suited For | Avg. Yield Recovery | Typical A260/A230 Improvement | Key Advantage | Key Limitation |
|---|---|---|---|---|---|---|
| Silica-Membrane Columns | Selective binding in high chaotropic salt, wash, elute. | High-throughput processing; Sputum (processed). | 70-90% | 1.8 → 2.0-2.2 | Consistency, ease of use. | May not remove all organics from stool. |
| Magnetic Bead (SPRI) | Paramagnetic particle binding & washing. | Automated high-throughput; all matrices. | 65-85% | 1.7 → 2.0-2.1 | Amenable to automation, scalable. | Requires optimization of bead:sample ratio. |
| Pre-Lysis Homogenization | Mechanical/chemical disruption before lysis. | Viscous sputum, fibrous stool. | Varies (+20-50%) | Moderate | Unlocks cells, reduces viscosity. | Additional step, potential RNA degradation risk. |
| Selective Precipitation | e.g., CP1/CP2 buffers or LiCl. | Polysaccharide-rich stool samples. | 50-70% | 1.5 → 2.0-2.4 | Highly effective for humic acids/polysaccharides. | Lower yield, requires centrifugation. |
| Post-Extraction Cleanup | e.g., Column rebinding or bead cleanup. | Any sample with residual inhibition. | 80-95% of input RNA | Can normalize to >2.0 | Salvages otherwise failed preps. | Added cost and time. |
| Inhibitor-Resistant Enzymes | Use of engineered RT & polymerases. | Mild to moderate inhibition. | N/A (acts on reaction) | N/A | Simple, post-extraction solution. | May not overcome severe inhibition, cost. |
Table 2: Impact of Inhibitor Removal on RT-qPCR Data (Theoretical Dataset)
| Sample Type | Prep Method | Mean Ct (Target Virus) | Ct SD | Mean Ct (Internal Control) | ΔCt vs. Clean Control | Inferred Inhibition |
|---|---|---|---|---|---|---|
| Sputum | Basic Lysis + Column | 28.5 | 0.8 | 23.8 | +2.1 | Moderate |
| Sputum | Homogenization + Column | 26.1 | 0.4 | 22.0 | +0.3 | Minimal |
| Stool | Standard Column | Undetected | N/A | 26.5 | +5.0 | Severe |
| Stool | Selective Precipitation + Column | 30.2 | 0.7 | 22.2 | +0.5 | Minimal |
| Control | Clean RNA | 21.8 | 0.2 | 21.7 | 0.0 | None |
Detailed Protocols
Protocol 1: Integrated RNA Isolation from Sputum with Mucolytic Homogenization
Application: Optimal for respiratory virus detection (e.g., RSV, Influenza, SARS-CoV-2) from raw or preserved sputum.
- Homogenization: Mix 100-500 µL of raw sputum with an equal volume of Sputasol (DTT-based) or 1X phosphate-buffered saline (PBS). Vortex vigorously for 10-15 seconds. Incubate at room temperature for 10 minutes.
- Lysis: Transfer up to 500 µL of homogenate to a tube containing 1-2 mL of guanidinium-thiocyanate-based lysis buffer (e.g., from RNeasy PowerMicrobiome Kit or TRIzol LS). Vortex for 1 minute.
- Phase Separation (if using TRIzol): Add 200 µL chloroform, shake vigorously, centrifuge at 12,000 x g for 15 min at 4°C. Transfer aqueous phase.
- RNA Binding: Add 1-1.5 volumes of ethanol (70-75%) to the lysate/aqueous phase. Mix by pipetting.
- Column Purification: Apply mixture to a silica-membrane column (e.g., RNeasy MinElute). Centrifuge at ≥8000 x g for 30 sec. Discard flow-through.
- Wash: Perform two washes with ethanol-based wash buffers. Centrifuge thoroughly to dry membrane.
- Elution: Elute RNA in 30-50 µL RNase-free water or TE buffer. Store at -80°C.
Protocol 2: Two-Stage RNA Isolation from Stool using Selective Precipitation
Application: Critical for enteric virus studies (e.g., Norovirus, Rotavirus) from stool specimens.
- Stool Suspension: Homogenize ~100 mg stool in 1 mL of appropriate lysis/transport buffer (e.g., NOREX Buffer, PBS). Centrifuge briefly at 500 x g for 2 min to pellet large debris.
- Primary Lysis: Transfer 500 µL supernatant to a tube with 500 µL of potent lysis buffer (e.g., from QIAamp Viral RNA Mini kit or equivalent guanidine buffer). Vortex.
- Inhibitor Precipitation: Add 100-150 µL of Inhibitor Removal Solution (e.g., Zymo Research Inhibitor Removal Technology solution or homemade CP2 buffer). Vortex and incubate on ice for 5-10 min.
- Debris Removal: Centrifuge at 12,000 x g for 5 min at 4°C. Carefully transfer supernatant to a new tube without disturbing the pellet.
- RNA Binding & Wash: Add ethanol to the supernatant (typically 1:1 vol), then apply to a silica column. Wash twice per manufacturer's instructions.
- Elution: Elute in 30-50 µL RNase-free water.
- Optional Post-Extraction Cleanup: If inhibition is suspected, repeat binding/wash/elution using a fresh column or SPRI beads.
Visualizations
Title: RNA Workflow from Sputum Sample
Title: Impact of Inhibitors on RT-qPCR Results
The Scientist's Toolkit: Research Reagent Solutions
| Reagent/Material | Primary Function | Example/Brand |
|---|---|---|
| Guanidinium Thiocyanate Lysis Buffer | Denatures proteins, inactivates RNases, provides binding condition for silica. | TRIzol, RLT Buffer (Qiagen), AVL Buffer (Qiagen). |
| Mucolytic Agent (DTT) | Breaks disulfide bonds in mucin, reducing viscosity of sputum. | Sputasol, Dithiothreitol solution. |
| Inhibitor Removal Solution (CP2) | Precipitates polysaccharides and humic acids from stool lysates. | Zymo Research IRT, in-house formulations. |
| Silica-Membrane Spin Columns | Selective binding and washing of RNA away from contaminants. | RNeasy MinElute (Qiagen), Zymo-Spin IIC Columns. |
| Magnetic Silica Beads | Solid-phase reversible immobilization (SPRI) for automated RNA cleanup. | AMPure XP/RNAClean XP beads, MagMAX beads. |
| Inhibitor-Resistant Enzyme Mixes | Engineered polymerases and reverse transcriptases tolerant to common inhibitors. | OneTaq RT-PCR with UNG, SuperScript IV RT. |
| Carrier RNA | Improves yield of low-copy viral RNA by enhancing silica binding efficiency. | Poly-A RNA, MS2 RNA (included in some kits). |
| Internal Control RNA | Distinguishes between true target-negative samples and PCR inhibition. | Exogenous RNA spiked into lysis buffer. |
Within the context of a thesis focused on RNA isolation and RT-qPCR for quantifying viral genome equivalents, the choice of reverse transcription (RT) primer is a critical determinant of data accuracy and biological relevance. This protocol outlines the application and optimization of three primary primer strategies: random hexamers, oligo-dT, and gene-specific primers (GSPs). The selection impacts cDNA yield, specificity, and the accurate representation of viral RNA species, directly influencing downstream qPCR quantitation.
Comparative Primer Strategies: Mechanism and Impact
Primer Binding Mechanisms and cDNA Output
Quantitative Comparison of RT Primer Performance
The following table synthesizes key performance metrics from recent literature, critical for viral load studies.
Table 1: Quantitative Comparison of Reverse Transcription Primers
| Parameter | Random Hexamers | Oligo-dT | Gene-Specific Primers (GSP) |
|---|---|---|---|
| Primary Binding Site | Throughout RNA, at random 6-mer complementary sequences. | Polyadenylate (poly-A) tail of eukaryotic mRNA. | Specific, user-defined sequence within target RNA. |
| Ideal RNA Input | Total RNA, degraded RNA, non-polyA RNA (e.g., many viral genomes). | Intact, polyadenylated mRNA. | High-quality RNA with known target sequence. |
| cDNA Yield | High (converts all RNA species). | Moderate (limited to polyA+ mRNA). | Low, but highly target-specific. |
| Sensitivity for Viral RNA | Excellent for viruses without poly-A tails (e.g., SARS-CoV-2, influenza). | Poor for non-polyadenylated viral RNAs; good for polyA+ viruses (e.g., HIV). | Excellent for the specific viral target. |
| Representation Bias | Least biased; entire RNA population. | Strong 3' bias; under-represents 5' ends of long transcripts. | Extremely biased to the targeted region. |
| Best for qPCR Target Location | Any region (full-length representation). | 3' UTR or last exons (due to 3' bias). | Pre-defined, precise amplicon location. |
| Multiplexing Potential | Excellent (cDNA library for multiple future targets). | Good for host mRNA targets. | Poor (each target requires separate RT reaction). |
| Key Advantage | Comprehensive detection, ideal for unknown or mixed viral samples. | Enrichment for eukaryotic mRNA; reduces background from rRNA. | Maximum sensitivity and specificity for a known target. |
| Major Limitation | High background from rRNA/tRNA; may dilute viral signal. | Will completely miss critical non-polyA viral targets. | Cannot discover novel or unexpected viral variants. |
Detailed Experimental Protocols
Protocol 4.1: Comparative RT Efficiency Assay for Viral RNA Quantification
Objective: To determine the optimal RT primer for detecting a specific viral genome equivalent from cell culture supernatant or patient RNA isolates.
I. Materials & Reagent Setup
- RNA Sample: Purified total RNA containing viral RNA (e.g., SARS-CoV-2 genomic RNA).
- Primers:
- Random Hexamers (50 µM)
- Oligo-dT (20) (50 µM)
- Gene-Specific Primer (reverse primer for viral target) (10 µM)
- Enzymes & Buffers: Reverse Transcriptase (e.g., SuperScript IV), associated 5x RT buffer, RNase inhibitor, DTT.
- Nucleotides: dNTP mix (10 mM each).
- Equipment: Thermal cycler, qPCR instrument.
II. Procedure
- RNA Primer Annealing Mix (Prepare in separate tubes for each primer type):
- Combine 1 µL of primer (from stocks above) with 100-1000 ng total RNA (or known copies of viral RNA standard) and 1 µL dNTP mix (10 mM) in a total volume of 13 µL.
- Heat mixture to 65°C for 5 minutes, then immediately place on ice for at least 1 minute.
- Reverse Transcription Master Mix:
- Per reaction: 4 µL 5x RT buffer, 1 µL DTT (0.1 M), 1 µL RNase inhibitor (40 U/µL), 1 µL Reverse Transcriptase (200 U/µL).
- Combine and Incubate:
- Add 7 µL of Master Mix to each annealed primer/RNA tube. Mix gently.
- Incubation: For Random Hexamers & Oligo-dT: 25°C for 10 min (primer annealing), 55°C for 30 min (extension), 80°C for 10 min (inactivation). For GSP: Use the specific Tm of the primer for the annealing step (e.g., 55°C for 30 min directly), then 80°C for 10 min.
- cDNA Dilution: Dilute cDNA 1:5 to 1:20 in nuclease-free water for qPCR analysis.
III. Downstream qPCR Validation
- Perform qPCR for the viral target using a validated assay.
- Include a no-RT control and a no-template control for each primer condition.
- Data Analysis: Compare Cq values and use a standard curve to calculate absolute copy numbers. The primer yielding the lowest Cq (highest sensitivity) for the viral target without amplifying no-RT controls is optimal.
Protocol 4.2: Multiplex RT using Random Hexamers for Host-Virus Profiling
Objective: To generate a broad cDNA library for simultaneous analysis of viral load and host gene expression (e.g., cytokine or interferon-stimulated genes).
Procedure:
- Follow Protocol 4.1 using Random Hexamers.
- Use the single, undiluted cDNA product as template in multiple, parallel qPCR reactions:
- One set with viral-specific primers/probe.
- Separate sets with host gene-specific primers/probe (e.g., GAPDH, ISG15, MX1).
- Normalize viral Cq to a host reference gene (∆Cq) for relative quantification across samples.
The Scientist's Toolkit: Research Reagent Solutions
Table 2: Essential Materials for RT Primer Optimization Studies
| Item | Function & Rationale |
|---|---|
| High-Sensitivity Reverse Transcriptase (e.g., SuperScript IV, LunaScript) | Provides robust cDNA synthesis even from low-abundance or degraded viral RNA, maximizing detection sensitivity. |
| RNase Inhibitor | Protects labile viral RNA from degradation during RT setup, crucial for accurate quantitation. |
| Quantified Viral RNA Standard (e.g., from ATCC or BEI Resources) | Serves as a positive control and allows generation of a standard curve for absolute quantification of genome equivalents. |
| Nuclease-Free Water & Tubes | Prevents exogenous RNase and DNA contamination that can lead to false-positive qPCR signals. |
| qPCR Master Mix with UDG | Contains uracil-DNA glycosylase (UDG) to prevent carryover contamination from previous PCR products, essential for clinical viral load assays. |
| Automated Nucleic Acid Extraction System | Ensures consistent, high-yield isolation of viral RNA from complex samples (e.g., swab media, serum), reducing pre-analytical variability. |
Within a broader thesis on RNA isolation and RT-qPCR for quantifying viral genome equivalents, the design and validation of the qPCR assay itself is the critical determinant of accuracy, sensitivity, and specificity. Poorly designed assays can lead to false negatives, inaccurate quantification, and irreproducible results, invalidating downstream conclusions. This application note details current best practices for primer and probe selection, amplicon sizing, and comprehensive validation, tailored for viral detection and quantification research.
Primer and Probe Design: Core Principles
General Design Parameters
Optimal primer and probe design balances thermodynamic properties with sequence specificity to ensure efficient and target-specific amplification.
Table 1: Optimal Design Parameters for qPCR Primers and Probes
| Parameter | Primer Recommendation | Probe Recommendation | Rationale |
|---|---|---|---|
| Length | 18-30 bases | 15-30 bases | Balances specificity and binding efficiency. |
| Melting Temp (Tm) | 58-60°C; ±1°C between forward & reverse. | 68-70°C; 7-10°C higher than primers. | Ensures probe binds before primers for efficient cleavage. |
| GC Content | 40-60% | 40-60% | Influences Tm and stability; avoid extremes. |
| 3' End | Avoid G or C repeats; last 5 bases ≤ 3 GC. | Must not have a G at the 5' end. | Prevents primer-dimer and non-specific extension; minimizes reporter quenching. |
| Amplicon Size | 70-150 bp (optimal for viral cDNA). | Position within amplicon. | Shorter fragments amplify with higher efficiency. |
| Specificity | BLAST against relevant genome databases. | Span an exon-exon junction if targeting mRNA/cDNA. | Avoids genomic DNA amplification; ensures viral specificity. |
Probe Selection and Chemistry
For viral genome equivalents, hydrolysis probes (TaqMan) are standard. Key considerations:
- Quencher: Use minor groove binder (MGB) or non-fluorescent quencher (NFQ) probes for shorter sequences and higher specificity.
- Label: Common 5' reporter dyes: FAM (most common), HEX, CY5. Select based on qPCR instrument channels.
- Avoid Secondary Structure: Use tools to ensure probe does not form hairpins or dimers.
Optimal Amplicon Size
Shorter amplicons (70-150 bp) are strongly preferred for viral qPCR due to higher amplification efficiency, crucial for accurate quantification across a wide dynamic range. This is especially important when analyzing partially degraded RNA samples from clinical or environmental sources. Amplicons >200 bp show significantly reduced efficiency.
Table 2: Impact of Amplicon Size on qPCR Efficiency
| Amplicon Size Range | Amplification Efficiency | Suitability for Viral qPCR | Notes |
|---|---|---|---|
| 60-100 bp | Very High (~95-105%) | Excellent | Ideal for fragmented RNA. Maximal sensitivity. |
| 100-150 bp | High (~90-100%) | Optimal | Best practice standard balance of specificity and efficiency. |
| 150-200 bp | Moderate (~85-95%) | Acceptable | Use if sequence constraints demand. |
| >200 bp | Lower (<85%) | Not Recommended | Risk of biased quantification, lower sensitivity. |
Comprehensive Assay Validation Protocols
A rigorously validated assay is essential for generating thesis-worthy data. The following protocols must be performed on each new primer/probe set.
Protocol 1: Standard Curve and Amplification Efficiency
Objective: Determine the quantitative performance (sensitivity, dynamic range, and PCR efficiency) of the assay.
- Template Preparation: Serially dilute (10-fold or 5-fold) a sample with known high copy number of the viral target (e.g., in vitro transcript, quantified plasmid, or high-titer viral RNA). Use at least 5 dilution points spanning the expected experimental range (e.g., 10^1 to 10^6 copies/µL).
- qPCR Run: Run all dilutions in triplicate on the same plate using the optimized qPCR master mix and cycling conditions.
- Data Analysis:
- Plot the mean Cq (Quantification Cycle) value (Y-axis) against the log10 template copy number (X-axis).
- Perform linear regression. The slope and R^2 (coefficient of determination) are calculated.
- Calculate Efficiency: % Efficiency = [10^(-1/slope) - 1] * 100.
- Validation Criteria: A robust assay has R^2 ≥ 0.990 and an efficiency between 90% and 110% (slope between -3.58 and -3.10).
Protocol 2: Specificity Testing
Objective: Confirm the assay amplifies only the intended viral target.
- Template Selection: Include the following in a qPCR run:
- Positive control (target viral RNA/cDNA).
- Negative Template Control (NTC, nuclease-free water).
- Non-target controls (RNA/cDNA from related viral strains, potential co-pathogens, or host genomic DNA).
- If targeting viral mRNA, include a -RT control (RNA without reverse transcriptase).
- Analysis: The assay is specific if:
- Strong amplification in positive control only.
- No amplification (Cq > 40 or undetermined) in NTC, non-target controls, and -RT control (for RNA viruses where genomic RNA is the target, -RT may still amplify).
Protocol 3: Limit of Detection (LoD) and Limit of Quantification (LoQ)
Objective: Establish the lowest concentration reliably detected and quantified.
- Prepare Dilutions: Create very low concentration dilutions of the target (e.g., 10, 5, 3, 1 copies/µL) in a background of negative RNA (e.g., yeast tRNA).
- Replicate Testing: Run each low-concentration dilution in a high number of replicates (≥20).
- LoD Calculation: The LoD is the lowest concentration at which ≥95% of replicates are positive (e.g., 19/20).
- LoQ Calculation: The LoQ is the lowest concentration where the coefficient of variation (CV) of the quantified copy number is ≤ 35%, ensuring quantitative precision.
Title: qPCR Assay Design and Validation Workflow
The Scientist's Toolkit: Research Reagent Solutions
Table 3: Essential Materials for Viral RT-qPCR Assay Development
| Item | Function in Viral Research | Example/Note |
|---|---|---|
| qPCR Design Software | In silico primer/probe design, specificity checks, and Tm calculation. | Primer-BLAST, IDT OligoAnalyzer, Beacon Designer. |
| Synthetic Viral Target | Positive control for standard curve, efficiency, and LoD studies. | Cloned plasmid or in vitro transcribed RNA of a conserved viral region. |
| High-Fidelity DNA Polymerase | Accurate amplification of template for cloning positive controls. | Used in generating standard material, not in the qPCR itself. |
| Reverse Transcriptase | Converts isolated viral RNA to cDNA for qPCR amplification. | Choose enzymes with high efficiency and robustness for potentially degraded samples. |
| Hot-Start Taq DNA Polymerase | Prevents non-specific amplification and primer-dimer formation during qPCR setup. | Essential for sensitive one-step or two-step RT-qPCR. |
| dNTP Mix | Nucleotides for cDNA synthesis and PCR amplification. | Use a balanced, high-quality mix for optimal performance. |
| Dual-Labeled Probe | Sequence-specific detection of amplified viral target via fluorescence. | TaqMan-style probe with 5' reporter (e.g., FAM) and 3' quencher (e.g., NFQ). |
| Nuclease-Free Water | Solvent for all master mixes and dilutions; prevents RNA/DNA degradation. | Critical for reducing background in NTCs. |
| qPCR Plates/Tubes | Reaction vessels compatible with the thermal cycler's detection system. | Use optically clear seals; ensure material minimizes reaction volume variation. |
| Commercial One-Step/Two-Step RT-qPCR Master Mix | Optimized buffer containing Taq, dNTPs, Mg2+, stabilizers for robust, reproducible reactions. | Simplifies setup; often includes ROX as a passive reference dye. |
Title: Core Components of a Viral qPCR Reaction
Application Notes
Within a thesis on RNA isolation and RT-qPCR for viral genome equivalents, constructing a precise standard curve is the cornerstone for absolute quantification. This protocol details the preparation of a serially diluted standard, enabling the correlation of Cycle Threshold (Cq) values to a known input copy number. Accurate standards are critical for determining viral load in research and drug development, such as assessing antiviral compound efficacy or measuring viral replication kinetics.
Protocol: Preparation and Serial Dilution of DNA Plasmid Standards
Principle: A plasmid containing the target viral sequence is linearized, purified, and quantified. A series of 10-fold serial dilutions is prepared to generate standards covering the expected dynamic range of the assay (e.g., 10^1 to 10^8 copies/µL).
Materials & Reagents: See "The Scientist's Toolkit" below.
Methodology:
Standard Stock Solution Preparation:
- Linearize 1-5 µg of purified plasmid using a restriction enzyme that cuts outside the cloned insert.
- Verify complete linearization by agarose gel electrophoresis.
- Purify the linearized DNA using a PCR purification or gel extraction kit. Elute in nuclease-free TE buffer or water.
- Quantify the purified DNA using a UV-Vis spectrophotometer (e.g., NanoDrop). Ensure A260/A280 and A260/A230 ratios are ~1.8 and >2.0, respectively.
- Calculate the copy number concentration of the stock solution using the formula:
Copy number per µL = [DNA concentration (g/µL) / (Plasmid length (bp) × 660)] × 6.022 × 10^23 - Prepare a high-concentration working stock (e.g., 10^9 copies/µL) in nuclease-free water or TE buffer. Aliquot and store at -20°C or -80°C.
Serial Dilution Workflow:
- Thaw all reagents and standards on ice. Vortex and briefly centrifuge.
- Label nine 1.5 mL microcentrifuge tubes (Dilution 1 through Dilution 9).
- Pipette 90 µL of nuclease-free water or the recommended dilution buffer into each tube.
- For the first dilution: Add 10 µL of the 10^9 copies/µL stock to the 90 µL in Tube 1 (Dilution 1). Vortex thoroughly for 5-10 seconds. This is now a 10^8 copies/µL standard.
- Serially dilute: Transfer 10 µL from Tube 1 (10^8 copies/µL) into Tube 2 (90 µL buffer). Vortex thoroughly. This yields 10^7 copies/µL.
- Repeat this 10-fold serial dilution process through Tube 8, creating a dilution series down to 10^1 copies/µL. Discard 10 µL from the final tube (Tube 8) after mixing.
- Include a "No Template Control" (NTC) of nuclease-free water.
- Critical: Use fresh pipette tips for each transfer to prevent carryover. Prepare dilutions in triplicate for robust technical replication.
RT-qPCR Plate Setup:
- Combine the RT-qPCR master mix, primers/probe, and nuclease-free water according to the kit manufacturer's instructions.
- Dispense the master mix into the appropriate wells of a qPCR plate.
- Add 2-5 µL of each standard dilution (in triplicate) and unknown samples to their respective wells.
- Seal the plate, centrifuge briefly, and run on the qPCR instrument using the optimized cycling conditions.
Data Presentation
Table 1: Example Serial Dilution Scheme for qPCR Standard Curve
| Dilution Tube | Dilution Factor | Copies/µL (Theoretical) | Volume of Stock (µL) | Volume of Diluent (µL) | Final Volume (µL) |
|---|---|---|---|---|---|
| Stock | - | 1.00E+09 | - | - | - |
| 1 | 10-fold | 1.00E+08 | 10 of Stock | 90 | 100 |
| 2 | 10-fold | 1.00E+07 | 10 of Tube 1 | 90 | 100 |
| 3 | 10-fold | 1.00E+06 | 10 of Tube 2 | 90 | 100 |
| 4 | 10-fold | 1.00E+05 | 10 of Tube 3 | 90 | 100 |
| 5 | 10-fold | 1.00E+04 | 10 of Tube 4 | 90 | 100 |
| 6 | 10-fold | 1.00E+03 | 10 of Tube 5 | 90 | 100 |
| 7 | 10-fold | 1.00E+02 | 10 of Tube 6 | 90 | 100 |
| 8 | 10-fold | 1.00E+01 | 10 of Tube 7 | 90 | 100 |
| NTC | - | 0 | - | 100 (water) | 100 |
Table 2: Expected qPCR Output and Curve Parameters
| Standard (copies/µL) | Mean Cq (Example) | Log10(Copy Number) | Efficiency (E) | R^2 | Slope (Ideal: -3.32) |
|---|---|---|---|---|---|
| 1.00E+08 | 12.5 | 8.0 | |||
| 1.00E+07 | 16.0 | 7.0 | |||
| 1.00E+06 | 19.4 | 6.0 | 99.5% | 0.999 | -3.34 |
| 1.00E+05 | 22.8 | 5.0 | |||
| 1.00E+04 | 26.1 | 4.0 | |||
| 1.00E+03 | 29.5 | 3.0 | |||
| 1.00E+02 | 32.9 | 2.0 | |||
| 1.00E+01 | 36.2 | 1.0 | |||
| NTC | Undetermined | - | - | - | - |
Mandatory Visualizations
Title: Serial Dilution Workflow for qPCR Standards
Title: Logic of Absolute Quantification via Standard Curve
The Scientist's Toolkit
Table 3: Essential Research Reagent Solutions for Standard Preparation
| Item | Function & Importance |
|---|---|
| Cloned Plasmid DNA | Contains the target viral sequence amplicon. Serves as the primary source for generating known copy number standards. |
| High-Fidelity Restriction Enzyme | Linearizes the plasmid to ensure consistent amplification efficiency compared to supercoiled DNA. |
| PCR Purification Kit / Gel Extraction Kit | Removes enzymes, salts, and primers post-linearization and gel verification, ensuring pure template for accurate quantification. |
| Nuclease-Free Water | Used for all dilutions and reaction setup. Prevents degradation of nucleic acids by contaminating nucleases. |
| TE Buffer (pH 8.0) | Optional diluent. Tris stabilizes pH; EDTA chelates Mg2+ to inhibit nucleases. Can improve long-term storage stability of stock. |
| UV-Vis Spectrophotometer | For accurate quantification and purity assessment (A260/A280, A260/A230) of the linearized plasmid stock. |
| Single-Channel & Multichannel Pipettes | Critical for accurate liquid handling during serial dilution and plate setup. Regular calibration is required. |
| Low-Binding Microcentrifuge Tubes | Minimizes adsorption of nucleic acids to tube walls, especially critical for low-copy-number dilutions. |
| RT-qPCR Master Mix | Contains DNA polymerase, dNTPs, buffer, and often reverse transcriptase for one-step protocols. Optimized for efficiency and sensitivity. |
| Target-Specific Primers & Probe | Defines the amplified region. Must be validated for high efficiency and specificity against the viral target sequence in the plasmid. |
This application note details the protocol for converting raw RT-qPCR cycle threshold (CT) values into absolute viral genome copy numbers per mL of original sample. This pipeline is a critical component of a broader thesis on RNA isolation and RT-qPCR for the quantification of viral genome equivalents, enabling standardized quantification essential for virology research, vaccine development, and therapeutic efficacy studies.
Core Principles and Calculations
The conversion from CT to copies/mL relies on a standard curve generated from serial dilutions of a known quantity of target nucleic acid. The fundamental relationship is described by the PCR efficiency (E), where E = 10^(-1/slope) - 1. An ideal reaction with 100% efficiency (E=1) doubles every cycle.
Key Quantitative Data:
Table 1: Interpretation of Standard Curve Parameters
| Parameter | Ideal Value | Typical Acceptable Range | Implication |
|---|---|---|---|
| Slope | -3.32 | -3.1 to -3.6 | Dictates PCR efficiency. |
| PCR Efficiency (E) | 100% (or 2.0) | 90–110% (1.9–2.1) | Proportion of template amplified per cycle. |
| R² (Coefficient of Determination) | 1.000 | ≥ 0.990 | Linearity of the standard curve. |
| Y-Intercept | Varies | High value indicates high sensitivity | Theoretical CT at 1 copy/reaction. |
Calculation of Initial Template Copy Number: The absolute quantity (Q) in each reaction well is calculated from the CT value using the standard curve equation: [ CT = slope \times \log_{10}(Q) + intercept ] Rearranged to solve for Q: [ Q = 10^{(CT - intercept)/slope} ]
Normalization to Original Sample Volume: The final concentration in the original clinical or research sample (e.g., nasopharyngeal swab in transport media) is calculated by accounting for all dilution and concentration factors during RNA extraction and assay setup. [ \text{Genome Copies/mL}{\text{original}} = Q \times \left( \frac{V{\text{elution}}}{V{\text{extracted}}} \right) \times \frac{1}{V{\text{sample}}} \times D ]
Where:
- Q = Calculated copy number per RT-qPCR reaction (from formula above).
- V_elution = Volume of buffer used to elute purified RNA (µL).
- V_extracted = Volume of purified RNA used in the RT-qPCR reaction (µL).
- V_sample = Volume of original sample used for RNA extraction (mL).
- D = Any pre-extraction dilution factor of the original sample (if applicable).
Table 2: Example Calculation from CT to Copies/mL
| Step | Parameter | Example Value | Calculation | Result |
|---|---|---|---|---|
| 1 | Sample CT | 28.5 | N/A | 28.5 |
| 2 | Standard Curve | Slope: -3.45, Int: 38.2 | Q = 10^((28.5 - 38.2)/-3.45) | Q = 15,850 copies/rxn |
| 3 | Volume Factors | Sample: 0.2 mL, Elution: 60 µL, Input to RT: 5 µL | 15,850 × (60 / 5) × (1 / 0.2) | 951,000 copies/mL |
| 4 | Pre-dilution | Sample diluted 1:2 in VTM | Multiply by 2 | 1,902,000 copies/mL |
Experimental Protocols
Protocol 2.1: Generation of a Quantitative Standard Curve
Objective: To create a reliable standard curve for absolute quantification. Materials: See "Scientist's Toolkit" below. Procedure:
- Standard Preparation: Obtain a quantified stock of target DNA or RNA (e.g., gBlock, plasmid, in vitro transcript). Verify concentration via spectrophotometry (A260).
- Calculate Stock Concentration: Convert ng/µL to copies/µL using the molecular weight of the standard. [ \text{copies/µL} = \frac{\text{concentration (g/µL)} \times 6.022 \times 10^{23}}{\text{length (bp)} \times 660 \text{ g/mol}} ]
- Serial Dilution: Perform a 10-fold serial dilution in nuclease-free water or carrier RNA solution to span the expected target range (e.g., from 10^7 to 10^1 copies/µL). Prepare each dilution in triplicate.
- Plate Setup: Include triplicate no-template controls (NTCs). Use the same master mix and reaction conditions as for test samples.
- RT-qPCR Run: Perform amplification according to optimized cycling parameters.
- Curve Analysis: Using the qPCR software, plot CT values (y-axis) against log10 starting quantity (x-axis) of the standards. The software should report the slope, intercept, R², and efficiency.
Protocol 2.2: Sample Processing and Data Normalization Workflow
Objective: To process unknown samples and normalize CT data to genome copies/mL. Procedure:
- RNA Extraction: Extract RNA from a known volume (Vsample) of clinical specimen (e.g., 200 µL) using a validated column- or bead-based method. Elute in a defined volume (Velution, e.g., 60 µL).
- Reverse Transcription: Synthesize cDNA using a targeted or random-primed reverse transcription protocol.
- qPCR Setup: Combine a defined volume (V_extracted, e.g., 5 µL) of cDNA with qPCR master mix and primers/probe. Run alongside the standard curve.
- CT Acquisition: Determine CT values for each sample using a consistent threshold method (e.g., automatic or manual set within exponential phase).
- Absolute Quantification: Using the standard curve equation, calculate the copy number (Q) in each reaction well.
- Volumetric Normalization: Apply the normalization formula (above) to account for all volumetric manipulations and report the final concentration in copies/mL of the original sample.
Visualization of the Data Analysis Pipeline
Diagram Title: From CT Value to Final Concentration Pipeline
Diagram Title: Experimental and Computational Workflow
The Scientist's Toolkit
Table 3: Essential Research Reagent Solutions and Materials
| Item | Function & Importance |
|---|---|
| Quantified Nucleic Acid Standard | (e.g., gBlock, plasmid, in vitro transcript). Serves as the calibrator for the absolute standard curve. Must be sequence-verified and accurately quantified. |
| Nuclease-Free Water | Used for preparing serial dilutions of standards and controls. Essential to prevent degradation of nucleic acids. |
| Carrier RNA | Often included in lysis buffers during RNA extraction from low viral load samples. Improves RNA recovery by providing a substrate for silica binding. |
| RT-qPCR Master Mix | Contains DNA polymerase, dNTPs, buffer, and often reverse transcriptase for one-step assays. Critical for robust and efficient amplification. |
| Target-Specific Primers & Probe | Defines the specificity and sensitivity of the assay. Probe-based chemistry (e.g., TaqMan) is preferred for absolute quantification. |
| RNA Extraction Kit | (Column- or magnetic bead-based). For consistent purification of viral RNA from complex biological samples. Determines Vsample and Velution. |
| Digital Pipettes & Calibrated Tips | Essential for accurate and precise liquid handling, especially when creating critical serial dilutions for the standard curve. |
| qPCR Instrument Software | Used to set the baseline, threshold, and calculate CT values. Must have absolute quantification analysis features. |
Solving Common Pitfalls: A Troubleshooting Guide for Reliable Viral RNA Quantification
Within a thesis investigating RNA isolation and RT-qPCR for quantifying viral genome equivalents, obtaining high-quality RNA is paramount. Poor yield and quality directly compromise downstream assays, leading to unreliable quantification. This application note systematically addresses common failure points: the use of RNA stabilization aids, optimization of lysis conditions, and effective DNase treatment.
Table 1: Impact of RNA Stabilization Aids on Yield and Integrity
| Stabilization Method | RNA Yield (µg per 10^6 cells) | RIN (RNA Integrity Number) | Key Advantage for Viral Research |
|---|---|---|---|
| Immediate Lysis (Trizol) | 8.5 ± 1.2 | 9.2 ± 0.3 | Baseline standard |
| RNAlater (4°C, 24h) | 8.1 ± 0.9 | 8.9 ± 0.4 | Preserves samples during transport |
| Snap-Freezing (-80°C) | 7.8 ± 1.5 | 8.5 ± 0.7 | Long-term archiving of infected samples |
| PAXgene Blood RNA Tube | 6.5 ± 0.8 | 8.0 ± 0.5 | Standardized for clinical blood samples |
Table 2: Effect of Lysis Conditions on RNA Recovery from Cultured Cells
| Lysis Buffer / Method | Homogenization | Yield (µg) | A260/A280 | A260/A230 | Suitability for Viral Particles |
|---|---|---|---|---|---|
| Acid Guanidinium-Phenol (TRIzol) | Vortex | 10.2 ± 1.1 | 1.98 ± 0.03 | 2.15 ± 0.1 | Excellent (lyses envelopes/capsids) |
| Chaotropic Salt + β-ME | Bead Mill | 9.5 ± 0.8 | 2.02 ± 0.02 | 2.05 ± 0.2 | Good |
| Mild Detergent (for Nuc. separation) | Pipetting | 4.1 ± 1.2 | 1.85 ± 0.10 | 1.80 ± 0.3 | Poor (may not release viral RNA) |
| Direct Column Binding | None | 3.5 ± 0.9 | 1.90 ± 0.05 | 1.92 ± 0.2 | Variable |
Table 3: DNase Treatment Protocols and Residual DNA Contamination
| DNase Treatment Protocol | Incubation Time/Temp | Post-Treatment Cleanup | ∆Cq in No-RT Control (GAPDH) | Impact on RNA Yield |
|---|---|---|---|---|
| On-column DNase I (Qiagen) | 15 min / RT | None | +8.5 cycles | <5% loss |
| In-solution DNase I (Ambion) | 30 min / 37°C | Required (PCI) | +10.2 cycles | 10-15% loss |
| Double DNase (Column + Solution) | 15 min RT + 30 min 37°C | Required | +12.1 cycles | 15-20% loss |
| No DNase | N/A | N/A | +2.1 cycles | N/A |
Detailed Experimental Protocols
Protocol 1: Evaluating RNA Stabilization Aids for Infected Cell Cultures
Objective: To compare RNA yield and quality from virus-infected cells preserved using different methods prior to homogenization. Materials: See "Scientist's Toolkit" below. Procedure:
- Cell Culture & Infection: Seed 1x10^6 Vero cells per well in a 6-well plate. Infect with virus (e.g., SARS-CoV-2 at MOI 0.1) for 24 hours.
- Stabilization: Harvest cells by trypsinization and divide pellet into four aliquots.
- A1: Immediate lysis in 1 mL TRIzol. Vortex 15 sec.
- A2: Resuspend in 1 mL RNAlater. Incubate 24h at 4°C, then pellet and lyse in TRIzol.
- A3: Snap-freeze pellet in liquid nitrogen, store at -80°C for 1 week. Thaw on ice and lyse in TRIzol.
- A4: Resuspend in PAXgene lysis buffer, incubate 2h at RT, then process per manufacturer.
- RNA Isolation: For TRIzol samples, add 200 µL chloroform, shake, centrifuge (12,000xg, 15 min, 4°C). Transfer aqueous phase, mix with 500 µL isopropanol, and incubate 10 min at RT. Centrifuge (12,000xg, 10 min, 4°C). Wash pellet with 75% ethanol, air dry, resuspend in nuclease-free water.
- QC: Quantify by spectrophotometry (A260/A280, A260/A230). Assess integrity via Bioanalyzer (RIN).
Protocol 2: Optimizing Lysis Conditions for Difficult Samples
Objective: To maximize RNA recovery from difficult-to-lyse samples (e.g., viral plaques, biofilms, tissue). Materials: See toolkit. Procedure:
- Sample Preparation: Divide a standardized difficult sample (e.g., infected cell pellet with high mucus content) into four equal aliquots.
- Lysis Methods:
- Chaotropic + Bead Beating: Add 600 µL RLT Plus buffer (Qiagen) + β-ME to pellet. Homogenize for 2 min at 30 Hz in a tissue lyser with 3mm beads. Centrifuge to clear lysate.
- TRIzol + Vortexing: Add 1 mL TRIzol, vortex vigorously for 30 sec. Incubate 5 min RT.
- Detergent-based + Mechanical: Add 500 µL of a mild lysis buffer (10 mM Tris, 1% NP-40). Pass through a 21-gauge needle 10 times.
- Direct Binding: Apply sample directly to a spin column with proprietary lysis buffer, incubate 5 min, then centrifuge.
- RNA Purification: Proceed with manufacturer's recommended steps for each buffer system (e.g., column binding for RLT, phase separation for TRIzol).
- Analysis: Quantify yield and purity. Perform RT-qPCR on a viral target and host gene (e.g., RNase P) to assess representative recovery.
Protocol 3: Rigorous DNase Treatment for Sensitive RT-qPCR
Objective: To eliminate genomic DNA contamination without degrading RNA, critical for accurate viral genome copy number determination. Materials: DNase I (RNase-free), 10x DNase Buffer, Nuclease-free water, Acid-Phenol:Chloroform (PCI), 3M Sodium Acetate (pH 5.2), 100% Ethanol. Procedure:
- Initial RNA: Start with 2 µg of RNA in 45 µL nuclease-free water.
- DNase Reaction: Add 5 µL of 10x DNase Buffer and 2 µL (2 U/µL) DNase I. Mix gently, spin briefly.
- Incubation: Incubate at 37°C for 30 minutes in a thermal cycler.
- Inactivation/Cleanup: Add 50 µL nuclease-free water and 100 µL PCI. Vortex vigorously for 15 sec. Centrifuge at 12,000xg for 5 min at 4°C.
- Precipitation: Transfer upper aqueous phase (~100 µL) to a new tube. Add 10 µL 3M sodium acetate (pH 5.2) and 250 µL 100% ethanol. Mix and incubate at -20°C for 1 hour. Centrifuge at 12,000xg for 20 min at 4°C.
- Wash & Resuspend: Carefully decant supernatant. Wash pellet with 500 µL 75% ethanol. Centrifuge 5 min. Air dry pellet 5-10 min. Resuspend in 20 µL nuclease-free water.
- Verification: Run a No-RT control for a multi-copy genomic target (e.g., GAPDH, β-actin) by qPCR. A ∆Cq of >7-10 cycles compared to the +RT sample indicates effective DNA removal.
Visualizations
Diagram Title: RNA Isolation Quality Control Workflow
Diagram Title: Diagnostic Decision Tree for RNA Issues
The Scientist's Toolkit: Research Reagent Solutions
| Item | Function in Viral RNA Isolation |
|---|---|
| RNAlater Stabilization Reagent | Preserves RNA integrity in tissues/cells immediately post-collection, inhibiting RNases. Critical for field or clinical samples. |
| TRIzol/Chloroform | Monophasic solution of phenol and guanidine isothiocyanate. Lyses cells, inactivates RNases, and separates RNA into the aqueous phase. Effective on viral envelopes. |
| RNeasy Plus Mini Kit (Qiagen) | Silicon-membrane column-based purification. Includes gDNA eliminator columns for effective DNA removal. Consistent for high-throughput. |
| DNase I, RNase-free | Enzyme that degrades contaminating double- and single-stranded DNA without degrading RNA. Essential for RT-qPCR specificity. |
| RNase Inhibitor (e.g., Recombinant RNasin) | Protects RNA from degradation by RNases during post-DNase handling and reverse transcription. |
| Agencourt RNAClean XP Beads | Solid-phase reversible immobilization (SPRI) beads for clean-up and concentration of RNA post-DNase treatment. |
| Bioanalyzer RNA Nano Chip | Microfluidics-based system for assessing RNA integrity (RIN) and quantifying yield. Superior to gel electrophoresis. |
| Acid-Phenol:Chloroform, pH 4.5 | Used for rigorous cleanup after in-solution DNase treatment. Removes proteins, enzymes, and lipids. |
1. Introduction and Thesis Context Within viral genome equivalents research, accurate quantification of viral RNA via RT-qPCR is paramount for understanding infection dynamics, therapeutic efficacy, and vaccine response. A critical, often overlooked challenge in this workflow is the presence of PCR inhibitors co-purified during RNA isolation from complex biological matrices (e.g., blood, sputum, tissue). These inhibitors can lead to significant underestimation of viral load, compromising research conclusions. This application note details a systematic approach, embedded within a broader thesis on robust RNA isolation and quantification, for identifying and overcoming PCR inhibition using exogenous spike-in controls and dilution strategies.
2. The Inhibitor Problem: Sources and Mechanisms Common inhibitors include hemoglobin, heparin, urea, IgG, polysaccharides, and phenolic compounds. Their mechanisms involve:
- Binding to or denaturing DNA polymerase.
- Chelating Mg²⁺ ions, a critical cofactor.
- Interacting with nucleic acids, preventing efficient denaturation or primer annealing.
3. Key Experimental Protocol: Inhibition Assessment Using an Exogenous Non-Competitive Spike-In Control
A. Principle A known quantity of non-homologous synthetic RNA or DNA (e.g., from plant, bacteriophage) is spiked into the lysis buffer prior to nucleic acid isolation. This control monitors efficiency through the entire process: RNA isolation, reverse transcription, and qPCR. A significant delay (increase) in the control's Cq (Quantification Cycle) value compared to its expected value in a clean background indicates the presence of inhibitors.
B. Detailed Protocol
- Spike-In Preparation: Dilute a commercial synthetic control RNA (e.g., Arabidopsis thaliana mRNA, MS2 phage RNA) to a working concentration in nuclease-free water. Determine the expected Cq value of this amount in an inhibition-free reaction (e.g., Cq ~25).
- Sample Spiking: Add a fixed volume (e.g., 5 µL) of the spike-in working solution directly to the clinical or tissue sample (e.g., 200 µL) in the lysis buffer. Mix thoroughly.
- RNA Isolation: Proceed with your standardized RNA isolation protocol (e.g., silica-membrane column-based purification). Elute in 30-50 µL.
- RT-qPCR Setup: Perform parallel one-step or two-step RT-qPCR assays:
- Target Assay: For the viral genome of interest.
- Spike-In Assay: Using primers/probe specific to the exogenous control.
- Data Analysis: Calculate the ∆Cq = Observed Cq(Spike-In) - Expected Cq(Spike-In). A ∆Cq > 1.0 suggests significant inhibition. The percent inhibition can be estimated from a standard curve of the control.
4. Mitigation Protocol: Dilution as a Primary Strategy
A. Principle Diluting the nucleic acid template reduces the concentration of inhibitors below their effective threshold, while the target nucleic acid concentration remains detectable. The optimal dilution factor must be determined empirically.
B. Detailed Protocol
- Prepare Dilutions: Using the eluted RNA, prepare a dilution series in nuclease-free water (e.g., 1:2, 1:5, 1:10).
- Re-amplify: Perform the target and spike-in RT-qPCR assays on each dilution.
- Identify Optimal Dilution: The correct dilution is identified when:
- The spike-in control Cq returns to its expected value (∆Cq ~0).
- The target viral Cq shifts by the log of the dilution factor (e.g., a ~2.32 cycle shift for a 1:5 dilution).
- The calculated viral titer (adjusted for dilution) plateaus or becomes consistent across dilutions.
5. Data Presentation
Table 1: Example Data from Inhibition Identification and Dilution Mitigation
| Sample ID | Dilution Factor | Spike-In Cq (Observed) | ∆Cq (vs. Expected) | Viral Target Cq (Observed) | Calculated Viral Load* (copies/µL) | Inference |
|---|---|---|---|---|---|---|
| Clinical-1 | 1 | 28.5 | +3.5 | 32.1 | 1.5 x 10³ | Severe Inhibition |
| Clinical-1 | 1:5 | 25.2 | +0.2 | 29.9 | 7.3 x 10³ | Inhibition Relieved |
| Clinical-1 | 1:10 | 25.1 | +0.1 | 30.6 | 7.1 x 10³ | Valid Result |
| Clinical-2 | 1 | 25.0 | 0.0 | 24.8 | 5.0 x 10⁵ | No Inhibition |
| Inhibition-Free Control | 1 | 25.0 | 0.0 | As per std curve | N/A | Baseline |
*Viral load calculated from a standard curve and adjusted for dilution factor.
6. Workflow Visualization
Diagram Title: Workflow for Identifying and Mitigating PCR Inhibition
7. The Scientist's Toolkit: Essential Research Reagent Solutions
| Item | Function & Rationale |
|---|---|
| Non-Homologous Exogenous Control RNA (e.g., synthetic At thaliana gene, MS2 RNA) | Spike-in template to monitor isolation and amplification efficiency without cross-reacting with viral or human targets. |
| Inhibitor-Resistant DNA Polymerase Mixes | Enzyme blends often containing BSA or other additives that enhance tolerance to common inhibitors. |
| Carrier RNA (e.g., Poly-A, tRNA) | Added during lysis to improve recovery of low-copy-number viral RNA and stabilize the spike-in control. |
| Nucleic Acid Diluent (Nuclease-free water or TE buffer) | For performing template dilutions without introducing new contaminants. |
| Standard Curve Template for Viral Target & Spike-In | Essential for absolute quantification and for determining expected Cq values of the spike-in control. |
| Silica-Membrane Columns with Inhibitor Removal Wash Buffers | Optimized wash buffers (often high-ethanol, high-salt) designed to remove specific inhibitor classes during purification. |
Within the context of a broader thesis on RNA isolation and RT-qPCR for quantifying viral genome equivalents, precise optimization of the polymerase chain reaction (PCR) is paramount. The accuracy and sensitivity of viral load quantification directly impact downstream analyses in diagnostics, pathogenesis studies, and antiviral drug development. This application note details a systematic approach to optimizing three critical, interdependent parameters: Mg2+ concentration, primer ratios, and thermal cycler parameters. The goal is to maximize reaction efficiency, specificity, and yield for reliable viral genome detection.
Core Parameters for Optimization
Magnesium Ion (Mg2+) Concentration
Mg2+ acts as a cofactor for thermostable DNA polymerase. It stabilizes the DNA double helix, facilitates primer binding, and is essential for enzymatic activity. Both insufficient and excessive Mg2+ can drastically reduce yield and specificity.
- Low [Mg2+]: Decreases polymerase activity, reduces yield, and can cause inconsistent amplification.
- High [Mg2+]: Increases non-specific binding, promotes primer-dimer formation, and can reduce fidelity.
Primer Ratio
The standard forward-to-reverse primer ratio is 1:1. Imbalances can lead to asymmetric amplification, where one strand is synthesized in excess, potentially reducing overall efficiency and causing issues in downstream applications like sequencing. Optimization is crucial when one primer has a significantly different annealing temperature or when performing specialized protocols.
Thermal Cycler Parameters
The three core thermal cycler parameters are:
- Annealing Temperature (Ta): Critical for primer specificity. Must be optimized based on primer Tm.
- Extension Time: Dependent on amplicon length and polymerase speed.
- Ramp Rate: The speed at which the instrument transitions between temperatures. Faster rates can improve specificity and reduce protocol time.
Table 1: Optimization Grid for Mg2+ Concentration and Annealing Temperature
| MgCl2 Concentration (mM) | Annealing Temp (°C) | Cq Value (Mean ± SD) | Amplification Efficiency (%) | Specificity (Melt Curve Peak) |
|---|---|---|---|---|
| 1.5 | 55 | 28.5 ± 0.8 | 78 | Broad, non-specific |
| 1.5 | 58 | 26.1 ± 0.3 | 92 | Single, sharp |
| 1.5 | 60 | 27.9 ± 0.5 | 85 | Single, sharp |
| 2.0 | 55 | 25.3 ± 0.4 | 105 | Single, sharp |
| 2.0 | 58 | 24.8 ± 0.2 | 98 | Single, sharp |
| 2.0 | 60 | 26.0 ± 0.3 | 95 | Single, sharp |
| 3.0 | 55 | 24.0 ± 0.6 | 115 | Multiple, non-specific |
| 3.0 | 58 | 23.5 ± 0.7 | 112 | Broad |
| 3.0 | 60 | 25.1 ± 0.5 | 101 | Single, sharp |
Table 2: Effect of Primer Ratio on Reaction Performance
| Forward:Reverse Primer Ratio | Cq Value (Mean ± SD) | Yield (ΔRFU) | Comments |
|---|---|---|---|
| 0.5:1 (0.5x Fwd) | 27.2 ± 0.9 | Low | Delayed Cq, reduced yield. |
| 1:1 (Standard) | 24.8 ± 0.2 | High | Optimal, balanced amplification. |
| 1:0.5 (0.5x Rev) | 26.8 ± 0.8 | Low | Delayed Cq, reduced yield. |
| 1.5:1 (1.5x Fwd) | 24.9 ± 0.4 | High | Comparable to 1:1, risk of off-target. |
| 1:1.5 (1.5x Rev) | 25.0 ± 0.3 | High | Comparable to 1:1, risk of off-target. |
Detailed Experimental Protocols
Protocol 4.1: Mg2+ and Annealing Temperature Gradient Optimization
Objective: To determine the optimal Mg2+ concentration and annealing temperature for a specific primer set targeting a viral genome sequence. Materials: See "The Scientist's Toolkit" below.
- Prepare a 2X concentrated master mix containing all components except MgCl2 and primers. Aliquot into separate tubes.
- Spike each aliquot with MgCl2 to final concentrations of 1.5, 2.0, 2.5, 3.0, and 3.5 mM.
- Add template (viral cDNA from RNA isolation protocol) and primers (at standard 0.2 µM each) to each Mg2+ concentration master mix.
- Program the thermal cycler with a gradient across the block (e.g., 55°C to 65°C) for the annealing step.
- Run the qPCR program: Initial denaturation (95°C, 2 min); 40 cycles of [Denaturation (95°C, 15 sec), Annealing (Gradient, 30 sec), Extension (72°C, 30 sec)]; followed by a melt curve analysis.
- Analyze results: The optimal condition is the combination yielding the lowest Cq with a single, sharp melt curve peak and an efficiency between 90-110%.
Protocol 4.2: Primer Ratio Titration
Objective: To assess the impact of asymmetric primer concentrations on amplification efficiency.
- Prepare a master mix with optimized Mg2+ concentration and all other components.
- Prepare primer stocks with varying ratios, keeping the total primer concentration constant (e.g., 0.4 µM total):
- Tube A: 0.1 µM Forward : 0.3 µM Reverse (1:3)
- Tube B: 0.2 µM Forward : 0.2 µM Reverse (1:1) Control
- Tube C: 0.3 µM Forward : 0.1 µM Reverse (3:1)
- Aliquot the master mix and add the different primer mixtures and template.
- Run qPCR using the optimized thermal profile from Protocol 4.1.
- Compare Cq values, amplification curves, and melt curves. The standard 1:1 ratio typically performs best for symmetric PCR.
Protocol 4.3: Ramp Rate Optimization for Specificity
Objective: To evaluate the effect of thermal cycler ramp rate on non-specific amplification.
- Using the optimized conditions from Protocols 4.1 & 4.2, set up reactions with a known difficult template (e.g., high GC-content viral region) or suboptimal primer pair.
- Run identical reactions on the same cycler using two programs:
- Program A: Standard or maximum ramp rate.
- Program B: Slowed ramp rate (e.g., 1-2°C/sec) during the annealing temperature transition.
- Compare the melt curves and gel electrophoresis results (if performed). A slower ramp rate can allow for more stringent primer binding, reducing off-target products.
Visualization of Workflows and Relationships
Diagram 1 Title: RT-qPCR Parameter Optimization Workflow
Diagram 2 Title: Mg2+ Concentration Impact on PCR
The Scientist's Toolkit: Research Reagent Solutions
Table 3: Essential Materials for RT-qPCR Optimization
| Item | Function in Optimization | Example/Note |
|---|---|---|
| Hot-Start DNA Polymerase | Reduces non-specific amplification during reaction setup. Critical for high-specificity assays. | Taq, Platinum Taq, SYBR Green master mixes. |
| MgCl2 Solution (25-50 mM) | Titratable source of magnesium ions. Allows fine-tuning of cofactor concentration. | Must be nuclease-free. Often included in buffer. |
| Ultra-Pure dNTP Mix | Building blocks for DNA synthesis. Impurities can affect Mg2+ availability and polymerase fidelity. | Use balanced, pH-stable solutions. |
| Optimized Buffer (10X) | Provides optimal pH, ionic strength, and stabilizers. May contain passive reference dyes for qPCR. | Often proprietary; part of commercial master mixes. |
| Sequence-Specific Primers | Designed for target viral sequence. Quality (HPLC-purified) and accurate Tm are prerequisites for optimization. | Resuspend in TE buffer or nuclease-free water. |
| Nuclease-Free Water | Solvent for all reactions. Prevents degradation of RNA/DNA and reaction components. | Critical for reproducibility. |
| Template cDNA | Reverse-transcribed viral RNA. Consistency in input quality is key for comparative optimization. | Use a consistent, mid-range concentration for tests. |
| Intercalating Dye (e.g., SYBR Green) | Binds double-stranded DNA, allowing real-time quantification. Optimization minimizes dye inhibition. | Included in most SYBR Green master mixes. |
| Thermal Cycler with Gradient Function | Allows testing of multiple annealing temperatures in a single run, drastically speeding up optimization. | Instruments from Bio-Rad, Thermo Fisher, Roche. |
Addressing High Variability and Poor Reproducibility in Replicates
High variability and poor reproducibility in replicate measurements, particularly within RNA isolation and RT-qPCR workflows for viral genome equivalents quantification, undermine data reliability in virology, vaccine development, and therapeutic research. This application note details protocols and best practices to mitigate these issues, framed within a thesis on robust viral genomic quantification.
Root Causes of Variability in Viral RNA Workflows
Key sources of variability are summarized in Table 1.
Table 1: Primary Sources of Variability in Viral RNA/qPCR Workflows
| Stage | Source of Variability | Impact on CV (%) |
|---|---|---|
| Sample Collection | Inconsistent volume, matrix (e.g., swab type), transport medium, time-to-processing. | Can exceed 50% |
| Nucleic Acid Isolation | Manual vs. automated, inhibitor carryover, RNA yield/quality, extraction efficiency. | 15-35% |
| Reverse Transcription | Enzyme fidelity/processivity, priming method (random vs. gene-specific), reaction conditions. | 10-25% |
| qPCR | Pipetting error, assay design (primer/probe), template input, instrument calibration. | 5-20% |
| Data Analysis | Cq threshold setting, normalization method, outlier management. | 5-15% |
CV: Coefficient of Variation. Data synthesized from recent literature and manufacturer technical notes.
Optimized Protocols
Protocol: Standardized Viral RNA Isolation from Cell Culture Supernatant
This protocol is designed for high reproducibility using silica-membrane technology.
Materials:
- Viral transport medium or cell culture supernatant.
- RNA extraction kit (e.g., QIAamp Viral RNA Mini Kit).
- Carrier RNA (optional, for low-titer samples).
- Ethanol (96-100%).
- Nuclease-free water.
- Microcentrifuge and vortex mixer.
- RNase-free pipettes and aerosol-barrier tips.
Procedure:
- Lysis: Pipette 140 µL of sample into a 1.5 mL microcentrifuge tube. Add 560 µL of prepared AVL buffer (with carrier RNA if required). Vortex for 15 sec. Incubate at room temp (15–25°C) for 10 min.
- Precipitation: Briefly centrifuge the tube. Add 560 µL of ethanol (96-100%) and mix by vortexing for 15 sec. Centrifuge briefly.
- Binding: Apply 630 µL of the mixture to a QIAamp Mini column. Centrifuge at 8,000 x g for 1 min. Discard flow-through. Repeat with remaining mixture.
- Wash 1: Add 500 µL AW1 buffer. Centrifuge at 8,000 x g for 1 min. Discard flow-through.
- Wash 2: Add 500 µL AW2 buffer. Centrifuge at 8,000 x g for 1 min. Discard flow-through.
- Dry Membrane: Centrifuge at full speed (20,000 x g) for 3 min to dry membrane.
- Elution: Place column in a clean 1.5 mL tube. Apply 60 µL AVE buffer or nuclease-free water to center of membrane. Incubate at room temp for 3 min. Centrifuge at 8,000 x g for 1 min. Store eluted RNA at -80°C.
Protocol: One-Step RT-qPCR for Viral Genome Equivalents
This protocol uses a master mix to minimize pipetting variability.
Materials:
- TaqPath 1-Step RT-qPCR Master Mix, CG.
- Primers and probe (target-specific, e.g., for SARS-CoV-2 N gene).
- Template RNA.
- Nuclease-free microcentrifuge tubes and plates.
- Optical adhesive film.
- Real-Time PCR System.
Procedure:
- Assay Design: Use publicly validated primer/probe sequences (e.g., CDC assays). Resuspend oligos to 100 µM stock. Prepare 20 µM (primer) and 5 µM (probe) working stocks.
- Master Mix Preparation: For a single 20 µL reaction: 10 µL 2X Master Mix, 1 µL 20X Primer/Probe Mix (final: 500 nM each primer, 125 nM probe), X µL RNA template (up to 5 µL), Nuclease-free water to 20 µL. Prepare a bulk master mix for all replicates + 10% excess.
- Plate Setup: Aliquot 15 µL of master mix into each well. Add 5 µL of template RNA (include no-template controls in triplicate). Seal plate, centrifuge briefly.
- RT-qPCR Cycling: Use manufacturer-recommended conditions: Stage 1: 25°C for 2 min (UDG incubation). Stage 2: 53°C for 10 min (RT). Stage 3: 95°C for 2 min (enzyme activation). Stage 4 (45 cycles): 95°C for 3 sec, 60°C for 30 sec (acquire fluorescence).
- Analysis: Set fluorescence threshold manually in the exponential phase across all runs. Use the same threshold for comparative experiments. Export Cq values.
The Scientist's Toolkit: Key Research Reagent Solutions
Table 2: Essential Materials for Reproducible Viral RNA/RT-qPCR
| Item | Function & Rationale for Reproducibility |
|---|---|
| Automated Nucleic Acid Extractor | Removes manual pipetting error, ensures consistent binding/wash/elution times and volumes. |
| Digital Pipettes with Regular Calibration | Ensures accurate and precise liquid handling, especially for critical sub-10 µL volumes. |
| Aerosol-Barrier Filter Tips | Prevents cross-contamination between samples and carryover of RNases. |
| Commercial One-Step RT-qPCR Master Mix | Provides standardized, pre-optimized concentrations of enzymes, dNTPs, and buffer. |
| Synthetic RNA Standard (External Calibrator) | Enables absolute quantification (genome copies/µL) and inter-run normalization. |
| Endogenous/Exogenous Internal Positive Control | Monitors extraction efficiency and identifies PCR inhibition within each sample. |
| Validated Primer/Probe Assay | Uses publicly available, sequence-verified assays with known performance characteristics. |
| Nuclease-Free Water & Certified RNase-Free Tubes | Eliminates degradation of RNA templates and oligonucleotides. |
Data Analysis and Normalization Strategy
Normalize target viral Cq values using a validated internal control (e.g., human RNase P gene for clinical samples, or spiked-in non-viral RNA). For absolute quantification, use a serial dilution of synthetic RNA standard (e.g., from 10^7 to 10^1 copies/µL) run on every plate to generate a standard curve. Replicates with a standard deviation >0.5 Cq (for technical triplicates) should be flagged and potentially repeated.
Workflow for Reproducible Viral Genome Quantification
Root Causes and Solutions for Variability
Within the broader thesis research on quantifying viral genome equivalents via RNA isolation and RT-qPCR, contamination control is the single most critical determinant of assay validity. Amplified cDNA and PCR products are potent sources of contamination that can lead to false positives, inflated copy numbers, and compromised data integrity. This document outlines a comprehensive contamination prevention strategy, integrating spatial, procedural, and technical controls tailored for high-sensitivity viral genomics research.
Core Principles: Spatial and Temporal Separation
The fundamental rule is the unidirectional workflow from pre-PCR to post-PCR areas. This separation must be physical, temporal, and procedural.
- Designated Zones: Establish three distinct, dedicated areas with separate equipment, lab coats, and consumables.
- Workflow Direction: Personnel must move from pre-PCR to post-PCR zones only, never in reverse, on a single day.
Table 1: Laboratory Zoning Specifications for PCR Workflows
| Zone | Primary Function | Key Equipment & Supplies | Personnel Directive |
|---|---|---|---|
| Pre-PCR (Clean Area 1) | RNA Isolation, Master Mix Prep | Centrifuge, vortex, pipettes, RNase-free tips/tubes, RT & PCR reagents. | Dedicated lab coat, gloves. Entry first in daily workflow. |
| Amplification (Link Area) | Thermal Cycling | Thermal cyclers, sealed plates/tubes. | No reagent handling. Load sealed plates only. |
| Post-PCR (Contaminated Area) | Product Analysis | Gel electrophoresis, plate readers, sequencers. | Dedicated lab coat & gloves. Never enter pre-PCR areas after handling amplicons. |
Diagram Title: Unidirectional PCR Workflow with Physical Zoning
Application Notes & Detailed Protocols
Protocol: Uracil-DNA Glycosylase (UDG/UNG) Carryover Prevention
Purpose: To enzymatically degrade contaminating amplicons from previous PCRs by incorporating dUTP and using UDG pretreatment.
Reagents:
- dNTP Mix containing dUTP (e.g., dATP, dCTP, dGTP, dUTP).
- Uracil-DNA Glycosylase (UDG/UNG).
- Standard RT-qPCR Master Mix components.
Methodology:
- dUTP Incorporation: Substitute dTTP with dUTP in the PCR master mix for all routine assays. Amplified products will contain uracil.
- Pre-PCR Decontamination: Include UDG (e.g., 0.2 U/µL) in the master mix assembled in the pre-PCR zone.
- Incubation: Perform a single incubation step at 25°C for 2-10 minutes immediately before thermal cycling. UDG will cleave the glycosidic bond of uracil in any contaminating double-stranded or single-stranded DNA.
- Enzyme Inactivation: Initiate the PCR program with a hot-start activation step (≥50°C for 2 min or 95°C for 1 min). The high temperature permanently inactivates UDG, protecting newly synthesized dUTP-containing amplicons.
- Proceed with standard cycling.
Protocol: Rigorous Pre-PCR Laboratory Technique
Purpose: To minimize introduction of contaminants during sample and reagent handling.
Detailed Workflow:
- Surface Decontamination: Before starting, clean all work surfaces, pipettes, and tube racks with a 10% (v/v) sodium hypochlorite (bleach) solution, followed by 70% ethanol to remove residual bleach. Use dedicated equipment for each zone.
- Master Mix Preparation:
- Assemble reactions in a PCR workstation or dead-air box located in the pre-PCR zone, preferably with UV sterilization.
- Use filtered pipette tips (aerosol barriers) for all liquid handling.
- Prepare a master mix for all reactions plus ≥10% excess to account for pipetting error. Aliquot into individual tubes or a PCR plate.
- Add template LAST. Use a separate, dedicated set of pipettes for template addition only.
- Positive Control Handling: Always pipette from the negative control (NTC) to the positive control, never the reverse. Use a dedicated aliquot of positive control template, stored in the pre-PCR area, and never return unused template to the stock vial.
Table 2: Quantitative Impact of Contamination Prevention Measures
| Prevention Measure | Typical Reduction in False Positives* | Key Limitation |
|---|---|---|
| Physical Separation of Workflows | >90% | Requires dedicated lab space/equipment. |
| UDG/dUTP System | 99% (for carryover amplicons) | Ineffective against genomic DNA or RNA contamination. |
| Use of Filtered Pipette Tips | ~95% (vs. non-filtered) | Does not prevent surface/glove contamination. |
| 10% Bleach Surface Decontamination | >99.9% (on surfaces) | Corrosive; requires careful handling and ethanol rinse. |
| Master Mix Aliquotting | ~80% (vs. repeated vial access) | Increases reagent cost per reaction. |
*Estimated based on comparative studies in clinical virology literature.
The Scientist's Toolkit: Research Reagent Solutions
Table 3: Essential Materials for Contamination-Free RT-qPCR
| Item | Function & Rationale |
|---|---|
| RNase/DNase-free Filter Pipette Tips | Prevents aerosol carryover into pipette shafts, a major contamination route. |
| Molecular Biology Grade Water | Nuclease-free water for reagent preparation; often the source of contamination if not certified. |
| Aliquoted, Single-Use Master Mix Stocks | Prevents repeated freeze-thaw cycles and cross-contamination of bulk stocks. |
| dNTP Mix with dUTP | Enables use of the enzymatic UDG decontamination system by producing uracil-containing amplicons. |
| Uracil-DNA Glycosylase (UDG) | Key enzyme for enzymatic degradation of contaminating PCR products from previous runs. |
| 10% Sodium Hypochlorite Solution | Effective oxidizing agent that destroys nucleic acid contaminants on surfaces and equipment. |
| UV-equipped Laminar Flow Hood/PCR Workstation | Provides a sterile, contained environment for master mix assembly; UV light cross-links stray amplicons. |
| Single-Tube, One-Step RT-qPCR Kits | Minimizes handling steps and tube openings between reverse transcription and amplification. |
| Optical Seal Films or Caps | Provide a secure, contamination-proof seal for reaction plates/tubes during cycling and storage. |
Diagram Title: Contaminant Sources and Corresponding Control Strategies
Ensuring Accuracy: Validation Strategies and Comparison to Emerging Technologies
This application note, framed within a thesis on viral genome equivalents research using RNA isolation and RT-qPCR, details the methodology for establishing three critical assay performance parameters: the Limit of Detection (LOD), the Limit of Quantification (LOQ), and the Dynamic Range. Robust determination of these metrics is foundational for generating reliable, reproducible, and interpretable data in viral load quantification, a cornerstone of virology research, diagnostics, and therapeutic development.
In the context of quantifying viral genome equivalents from clinical or research samples, the analytical sensitivity and working range of the RT-qPCR assay are paramount. The LOD defines the lowest concentration of viral target that can be reliably distinguished from zero (a blank), with a defined probability (typically 95%). The LOQ is the lowest concentration that can be quantified with acceptable precision (e.g., ≤ 25% CV) and accuracy (e.g., 80-120% recovery). The Dynamic Range spans from the LOQ to the Upper Limit of Quantification (ULOQ), the highest concentration where quantification remains linear and precise. Establishing these parameters validates the assay for its intended purpose, ensuring data integrity for downstream analysis and decision-making.
Key Definitions & Calculations
| Parameter | Definition | Typical Calculation Method (RT-qPCR) | Acceptable Criteria (Example) |
|---|---|---|---|
| Limit of Detection (LOD) | Lowest analyte concentration reliably detected. | LOD = Mean(Blank) + 1.645*(SDLow Concentration Sample). Confirm with ≥ 95% detection in 20+ replicates. | ≥ 95% detection rate at the claimed LOD. |
| Limit of Quantification (LOQ) | Lowest concentration quantified with stated precision and accuracy. | LOQ = Lowest concentration where CV ≤ 25% and mean measured concentration is within 80-120% of expected value. | CV ≤ 25%; Accuracy 80-120%. |
| Dynamic Range | Range from LOQ to ULOQ where response is linear, precise, and accurate. | Established via linearity and precision profile across 6-8 logs of concentration. | R² ≥ 0.99, Efficiency 90-110%, precision (CV) and accuracy within acceptable limits across the range. |
| Upper LOQ (ULOQ) | Highest concentration in the dynamic range. | Highest concentration where precision (CV ≤ 25%) and accuracy (80-120%) are maintained without saturation. | CV ≤ 25%; Accuracy 80-120%. |
Protocol 1: Determining LOD and LOQ for a Viral RT-qPCR Assay
Objective
To empirically determine the LOD and LOQ for an RT-qPCR assay targeting a specific viral genome (e.g., SARS-CoV-2 N gene).
Materials & Reagents (The Scientist's Toolkit)
| Item | Function | Example Product/Catalog Number |
|---|---|---|
| Synthetic Viral RNA | Provides a stable, quantifiable standard for generating dilution series. | Twist Synthetic SARS-CoV-2 RNA Control. |
| Nuclease-Free Water | Diluent for RNA standards; must be RNase-free to prevent degradation. | ThermoFisher, AM9937. |
| RT-qPCR Master Mix | Contains reverse transcriptase, DNA polymerase, dNTPs, buffer, and salts for one-step reaction. | TaqPath 1-Step RT-qPCR Master Mix. |
| Sequence-Specific Primers/Probe | Ensures specific amplification and detection of the viral target. | CDC 2019-nCoV N1 Assay primers/probe. |
| qPCR Instrument | Provides thermal cycling and real-time fluorescence detection. | Applied Biosystems QuantStudio 5. |
| qPCR Plates/Tubes | Reaction vessels compatible with the instrument. | MicroAmp Optical 96-Well Plate. |
Procedure
- Prepare Dilution Series: Serially dilute (e.g., 10-fold) the synthetic viral RNA in nuclease-free water across a range expected to bracket the anticipated LOD/LOQ (e.g., from 10^6 to 10^0 copies/µL). Include a minimum of 3 replicates per dilution level.
- Include Blank Samples: Prepare at least 10 replicates of a no-template control (NTC) containing nuclease-free water instead of RNA.
- Perform RT-qPCR: Set up reactions according to master mix protocol. Load all dilution replicates, NTCs, and any necessary controls. Run the optimized thermal cycling protocol.
- Analyze Data: Record Cq values for all wells. Exclude any outliers based on pre-defined criteria (e.g., significant deviation from replicate Cqs).
Data Analysis for LOD
- Calculate the mean and standard deviation (SD) of the Cq values for the dilution level closest to but above the noise (lowest detectable concentration).
- LOD (Cq-based): LODCq = Mean(Cqlow) + 3*SD(Cqlow). Convert this Cq value to concentration using the standard curve.
- LOD (Probabilistic): Alternatively, identify the lowest concentration where 19 out of 20 (95%) replicates produced a detectable Cq value.
Data Analysis for LOQ
- For each dilution level, calculate the Coefficient of Variation (CV) of the measured concentration (derived from a standard curve run in parallel) and the accuracy (% of expected concentration).
- The LOQ is the lowest concentration where both the CV is ≤ 25% and the mean measured concentration is within 80-120% of the expected value.
Protocol 2: Establishing Dynamic Range and Linearity
Objective
To determine the linear dynamic range and amplification efficiency of the viral RT-qPCR assay.
Procedure
- Prepare a 6 to 8-log dilution series of synthetic RNA, with at least 5 data points across the range (e.g., 10^1 to 10^7 copies/µL). Use 3-5 replicates per point.
- Run the dilution series alongside an NTC in the same RT-qPCR run.
- Plot the mean Cq value (y-axis) against the log10 of the input copy number (x-axis).
- Perform linear regression analysis. The Dynamic Range is defined by the linear portion of this plot (R² ≥ 0.99).
- Calculate Amplification Efficiency (E) using the slope of the standard curve: E = [10^(-1/slope)] - 1. Ideal efficiency is 100% (slope = -3.32).
Results Interpretation
A robust assay will show a linear dynamic range spanning 6-8 orders of magnitude with an efficiency between 90-110%. The LOQ defines the lower bound, and the point where precision/accuracy fail or the curve plateaus defines the ULOQ.
Diagrams
Title: Workflow for Establishing LOD, LOQ, and Dynamic Range
Title: Conceptual Relationship of LOD, LOQ, and Dynamic Range
Meticulous determination of LOD, LOQ, and dynamic range is non-negotiable for producing credible quantitative data in viral genome research. The protocols outlined herein, when followed rigorously, provide a clear framework for assay validation. These performance characteristics directly inform the interpretation of experimental results, especially for samples with low viral loads, and are essential for assay standardization across laboratories in both research and drug development contexts.
Within the broader thesis on quantifying viral genome equivalents via RNA isolation and RT-qPCR, rigorous assay validation is non-negotiable. This document provides detailed application notes and protocols for establishing the precision (intra- and inter-assay), accuracy, and reproducibility of the RT-qPCR assay. These parameters are foundational for generating reliable, publication-quality data on viral load, essential for diagnostics, vaccine development, and antiviral drug efficacy studies.
Key Validation Parameters: Definitions and Calculations
Accuracy: Closeness of the mean measured value to the true value. In RT-qPCR, this is assessed using standardized reference materials with known copy numbers. Precision: Closeness of agreement between independent measurements under stipulated conditions.
- Intra-assay Precision (Repeatability): Variation observed within a single run, plate, or operator on the same day.
- Inter-assay Precision (Intermediate Precision/Reproducibility): Variation observed across different runs, days, operators, or instruments. Reproducibility: A broader measure of precision under changed conditions, often between laboratories.
Quantitative measures are derived from replicate measurements (Cq values) of controls across the dynamic range of the assay. Key statistics include:
- Mean Cq & Standard Deviation (SD): For precision.
- Coefficient of Variation (%CV): (SD / Mean Cq) * 100. A %CV < 5% is typically acceptable for Cq values.
- Calculated vs. Expected Concentration: For accuracy, using a standard curve.
Table 1: Example Intra-assay and Inter-assay Precision Data for a Viral RT-qPCR Assay
| Validation Parameter | Sample/Control (Theoretical Copies/µL) | N (Replicates) | Mean Cq | SD (Cq) | %CV | Mean Calculated Copies/µL (SD) | % Recovery vs. Expected |
|---|---|---|---|---|---|---|---|
| Intra-assay Precision | High (1 x 10^5) | 8 (within plate) | 22.15 | 0.18 | 0.81 | 9.87 x 10^4 (0.41 x 10^4) | 98.7 |
| Medium (1 x 10^3) | 8 (within plate) | 28.72 | 0.22 | 0.77 | 9.95 x 10^2 (0.32 x 10^2) | 99.5 | |
| Low (1 x 10^1) | 8 (within plate) | 34.88 | 0.41 | 1.17 | 10.3 x 10^1 (0.8 x 10^1) | 103.0 | |
| Inter-assay Precision | High (1 x 10^5) | 24 (3 plates, 3 days) | 22.21 | 0.31 | 1.40 | 9.81 x 10^4 (0.62 x 10^4) | 98.1 |
| Medium (1 x 10^3) | 24 (3 plates, 3 days) | 28.81 | 0.38 | 1.32 | 9.88 x 10^2 (0.45 x 10^2) | 98.8 | |
| Low (1 x 10^1) | 24 (3 plates, 3 days) | 34.95 | 0.65 | 1.86 | 10.1 x 10^1 (1.1 x 10^1) | 101.0 | |
| Accuracy (Standard Curve) | Serial Dilution (10^6 - 10^1) | 3 per point | N/A | N/A | N/A | N/A | R^2 = 0.999, Efficiency = 98.5% |
Experimental Protocols
Protocol 4.1: Intra-assay Precision (Repeatability) Assessment
Objective: Determine variation within a single RT-qPCR run. Materials: See "The Scientist's Toolkit" (Section 6). Procedure:
- Prepare a master mix containing all reaction components (enzyme, buffer, primers/probe, water) for N+2 replicates per control sample.
- Aliquot the master mix into N wells (e.g., N=8) of a qPCR plate.
- Add the same extracted RNA sample (or synthetic RNA control) at high, medium, and low concentrations (covering the assay's dynamic range) to the respective replicate wells.
- Run the RT-qPCR protocol under optimized, standard conditions.
- Record the Cq values for all replicates.
- Analysis: Calculate the mean, SD, and %CV for the Cq values at each concentration level. %CV should ideally be ≤ 2.5%.
Protocol 4.2: Inter-assay Precision (Intermediate Precision) Assessment
Objective: Determine variation across different runs, days, and/or operators. Materials: As per Protocol 4.1. Use aliquots from a large, homogenous, and well-characterized RNA control stock stored at -80°C. Procedure:
- Over three separate days (or with two different operators), repeat the intra-assay precision experiment (Protocol 4.1) in its entirety.
- Each day/run should involve fresh preparation of all reagents (except the frozen RNA control stock) and master mix.
- Use the same instrument or different calibrated instruments if assessing instrument-to-instrument variation.
- For each concentration level, pool the Cq values from all runs (e.g., 3 runs x 8 replicates = 24 data points).
- Analysis: Calculate the overall mean, SD, and %CV for the pooled Cq data. %CV ≤ 5% is generally acceptable.
Protocol 4.3: Accuracy Assessment via Standard Curve
Objective: Determine the relationship between Cq and input quantity, and the assay's efficiency. Materials: A serial dilution of RNA with a known concentration (e.g., in vitro transcribed RNA quantified by spectrophotometry). Procedure:
- Prepare a 10-fold serial dilution (e.g., from 10^6 to 10^0 copies/µL) of the known standard in nuclease-free water. Use a carrier RNA (e.g., 10 ng/µL yeast tRNA) in the diluent to stabilize low concentrations.
- For each dilution, prepare a minimum of 3 replicate RT-qPCR reactions as per the standard protocol.
- Run the plate.
- Analysis:
- Plot the mean Cq (y-axis) against the logarithm of the known input concentration (x-axis).
- Perform linear regression. The slope is used to calculate amplification efficiency: Efficiency % = [10^(-1/slope) - 1] * 100. Ideal range: 90-110%.
- The R^2 value indicates linearity and should be >0.990.
- % Recovery at each point can be calculated as (Calculated Concentration from curve / Known Input Concentration) * 100.
Visualization: Experimental Workflows and Relationships
Intra-assay Precision Workflow
Inter-assay Precision Workflow
Validation Parameter Hierarchy
The Scientist's Toolkit: Research Reagent Solutions
Table 2: Essential Materials for RT-qPCR Validation Experiments
| Item | Function/Benefit in Validation |
|---|---|
| Quantified RNA Standard (e.g., in vitro transcribed viral target RNA) | Serves as the "truth" for accuracy assessment. Must be accurately quantified (e.g., by digital PCR) and aliquoted for long-term consistency. |
| Commercial One-Step/Two-Step RT-qPCR Master Mix | Provides standardized, high-efficiency enzymes and buffers, minimizing reagent-based inter-assay variation. Includes reverse transcriptase and DNA polymerase. |
| Assay-Specific Primers & Hydrolysis Probe (FAM/BHQ1) | Target-specific oligonucleotides. Dual-labeled probe (e.g., FAM) increases specificity over intercalating dyes, crucial for accurate quantification. |
| Nuclease-Free Water | Prevents RNA degradation and enzyme inhibition during reaction setup. |
| Positive Control RNA (Extracted from infected culture or synthetic) | Used as the test sample for precision experiments. Must be homogenous and aliquoted from a single large batch. |
| Carrier RNA (e.g., Yeast tRNA) | Added to dilution buffers to stabilize low-concentration RNA standards, preventing adsorption to tubes and improving accuracy at low copy numbers. |
| qPCR Plates & Seals | Low-adsorption, optically clear plates ensure consistent thermal conductivity and fluorescence detection across all wells and runs. |
| Calibrated Pipettes & Tips | Critical for accurate serial dilution and reagent dispensing. Regular calibration is mandatory for reproducible results. |
| Real-Time PCR Instrument | Must be well-maintained and calibrated for optical and thermal uniformity. Instrument-to-instrument validation may be required. |
In the study of viral dynamics, vaccine efficacy, and antiviral drug development, the precise quantification of viral RNA is paramount. The standard workflow—RNA isolation, reverse transcription (RT), and quantitative polymerase chain reaction (qPCR)—has been dominated by RT-qPCR. However, the emergence of digital PCR (dPCR) presents an alternative for absolute quantification without standard curves. This application note provides a comparative analysis of RT-qPCR versus RT-dPCR (collectively, RT-dPCR when combined with reverse transcription) for the absolute quantification of viral genome equivalents, detailing key protocols and decision-making criteria for researchers.
Comparative Performance Data
Table 1: Head-to-Head Comparison of RT-qPCR and dPCR for Viral RNA Quantification
| Parameter | RT-qPCR | Digital PCR (RT-dPCR) |
|---|---|---|
| Quantification Type | Relative or indirect absolute (requires standard curve) | Direct absolute (no standard curve required) |
| Precision & Sensitivity | High. Typically sensitive to ~10 copies/reaction. Can be affected by PCR inhibition. | Very High. Capable of detecting single molecules. More tolerant of PCR inhibitors. |
| Dynamic Range | Wide (~7-8 log10). Can be constrained by standard curve accuracy. | Linear but narrower optimal range (~4-5 log10 per run). Excellent for low copy numbers. |
| Accuracy & Reproducibility | Dependent on standard curve quality and reference materials. Inter-lab variability can be higher. | Superior for absolute counts. Higher reproducibility due to endpoint, binary (positive/negative) readout. |
| Throughput & Speed | High throughput (96/384-well plates). Faster time-to-result for standard curves. | Generally lower throughput (chamber/chip-based). Slower partition generation and analysis. |
| Cost per Sample | Lower reagent and consumable costs. | Higher per-sample cost due to specialized chips/cartridges and instruments. |
| Key Application in Viral Research | Gold standard for high-throughput screening, viral load monitoring, and gene expression. | Ideal for low viral load detection, rare variant identification, and validating qPCR standards. |
Table 2: Representative Experimental Data from a SARS-CoV-2 RNA Quantification Study
| Method | Input Copy Number (Theoretical) | Measured Value (Mean ± SD) | Coefficient of Variation (CV) |
|---|---|---|---|
| RT-qPCR | 1000 copies/µL | 978 ± 125 copies/µL | 12.8% |
| RT-dPCR | 1000 copies/µL | 1012 ± 45 copies/µL | 4.4% |
| RT-qPCR | 10 copies/µL | 8.5 ± 3.1 copies/µL | 36.5% |
| RT-dPCR | 10 copies/µL | 9.8 ± 1.8 copies/µL | 18.4% |
Detailed Experimental Protocols
Protocol A: RT-qPCR for Absolute Quantification of Viral Genome Equivalents
Objective: To quantify viral RNA copies per unit volume using a DNA standard curve. I. RNA Isolation & Quality Control:
- Extract total RNA from cell culture/viral transport media using a silica-membrane column kit with DNase I treatment.
- Elute in 30-50 µL RNase-free water.
- Assess purity (A260/A280 ~2.0) and concentration via spectrophotometry. Store at -80°C.
II. Reverse Transcription (cDNA Synthesis):
- Reaction Mix (20 µL):
- Isolated RNA: up to 1 µg (in variable volume)
- Oligo(dT) and/or Target-Specific Primer: 1 µL (10 µM)
- dNTP Mix: 1 µL (10 mM each)
- RNase Inhibitor: 0.5 µL (20 U/µL)
- 5x Reverse Transcriptase Buffer: 4 µL
- Reverse Transcriptase (e.g., M-MLV): 1 µL (200 U/µL)
- Nuclease-free water to 20 µL.
- Thermal Cycling:
- 25°C for 5 min (primer annealing).
- 50°C for 45-60 min (reverse transcription).
- 70°C for 15 min (enzyme inactivation).
- Hold at 4°C. Dilute cDNA 1:5 for qPCR.
III. Quantitative PCR with Standard Curve:
- Prepare DNA Standard: Use a plasmid containing the viral target amplicon. Perform serial 10-fold dilutions (e.g., 107 to 101 copies/µL) in TE buffer.
- qPCR Reaction (20 µL):
- 2x SYBR Green or TaqMan Master Mix: 10 µL
- Forward/Reverse Primer Mix: 0.8 µL (10 µM each)
- TaqMan Probe (if used): 0.4 µL (10 µM)
- cDNA template or Standard: 2 µL
- Nuclease-free water to 20 µL.
- Run qPCR:
- Stage 1: 95°C for 3 min (polymerase activation).
- Stage 2 (40 cycles): 95°C for 15 sec, 60°C for 1 min (data acquisition).
- Analysis: The software generates a standard curve (Cq vs. log10 copy number). Apply the linear equation to unknown sample Cq values to calculate absolute copy numbers, accounting for dilution factors.
Protocol B: RT-dPCR for Direct Absolute Quantification
Objective: To directly quantify viral RNA copies/µL without a standard curve via sample partitioning. I. RNA Isolation & Reverse Transcription: Perform as described in Protocol A, Steps I & II.
II. Digital PCR Assay Setup (Droplet-based system example):
- Prepare dPCR Reaction Mix (20 µL):
- 2x ddPCR Supermix for Probes (No dUTP): 10 µL
- Target-specific primers (20x): 1 µL (900 nM final)
- FAM-labeled TaqMan Probe (20x): 1 µL (250 nM final)
- cDNA template: 2-5 µL (optimal for 100-100,000 copies/reaction)
- RNase-free water to 20 µL.
- Generate Droplets: Load the 20 µL reaction mix and 70 µL of droplet generation oil into a DG8 cartridge. Generate droplets in the droplet generator. Transfer the emulsified sample (~40 µL) to a 96-well PCR plate. Seal firmly.
III. Endpoint PCR Amplification:
- Run the plate on a thermal cycler with the following program:
- 95°C for 10 min.
- 40 cycles of: 94°C for 30 sec, 60°C for 1 min (ramp rate: 2°C/sec).
- 98°C for 10 min (enzyme deactivation).
- Hold at 4°C.
IV. Droplet Reading & Quantification:
- Load the plate into a droplet reader.
- The reader measures fluorescence in each individual droplet (~20,000 per well), classifying them as positive (contains target) or negative (does not).
- Absolute quantification is calculated using Poisson statistics: Copies/µL = –ln(1 – p) / v, where p is the fraction of positive droplets and v is the droplet volume (nL).
Diagrams and Workflows
Title: RT-qPCR Absolute Quantification Workflow
Title: RT-dPCR Absolute Quantification Workflow
Title: Method Selection Decision Tree
The Scientist's Toolkit: Key Research Reagent Solutions
Table 3: Essential Materials for Viral RNA Quantification Studies
| Item | Function & Application |
|---|---|
| Silica-Membrane RNA Kits | For high-quality, inhibitor-free viral RNA isolation from complex biological fluids. Essential for both RT-qPCR and RT-dPCR. |
| DNase I (RNase-free) | To remove contaminating genomic DNA during RNA purification, preventing false-positive signals. |
| Reverse Transcriptase (e.g., M-MLV, HiScript) | Enzyme for synthesizing first-strand cDNA from viral RNA templates. Choice impacts efficiency and yield. |
| RNase Inhibitor | Protects RNA templates from degradation during cDNA synthesis, crucial for low-copy targets. |
| Hot-Start Taq DNA Polymerase | Reduces non-specific amplification in both qPCR and dPCR, improving sensitivity and precision. |
| SYBR Green or TaqMan Master Mix | qPCR-specific. Contains dyes/probes, dNTPs, buffer, and polymerase for real-time detection. |
| ddPCR Supermix for Probes | dPCR-specific. Optimized for droplet formation and stability, containing necessary reagents for probe-based detection. |
| Quantified DNA Standard (G-block/Plasmid) | For generating the standard curve in RT-qPCR. Must be sequence-identical to the viral target amplicon. |
| Droplet Generation Oil & Cartridges | Consumables for partitioning samples in droplet-based dPCR systems. |
| Nuclease-Free Water | Used in all reaction setups to prevent nucleic acid degradation by environmental nucleases. |
Within viral genome equivalents research, the gold standard has long been RNA isolation followed by reverse transcription quantitative PCR (RT-qPCR). This paradigm offers high sensitivity and precise quantification, essential for determining viral load, drug efficacy, and understanding pathogenesis. However, the need for rapid, field-deployable diagnostics and high-throughput screening has driven the adoption of isothermal amplification methods, notably Reverse Transcription Loop-Mediated Isothermal Amplification (RT-LAMP). This application note evaluates RT-LAMP in the context of a thesis focused on accurate viral quantification, directly comparing its operational advantages against the quantification accuracy of RT-qPCR.
Comparative Performance Data
Table 1: Direct Comparison of RT-qPCR vs. RT-LAMP for Viral RNA Detection
| Parameter | RT-qPCR | RT-LAMP |
|---|---|---|
| Amplification Temperature | Thermal cycling (e.g., 50-95°C) | Isothermal (60-65°C constant) |
| Typical Time-to-Result | 1.5 - 2.5 hours | 15 - 60 minutes |
| Quantification Capability | Excellent (Wide dynamic range, high precision) | Limited (Primarily qualitative/semi-quantitative) |
| Sensitivity | High (Can detect single-digit copy numbers) | Comparable to High (Similar to PCR in many studies) |
| Specificity | High (Probe-based detection) | High (Uses 4-6 primers targeting 6-8 regions) |
| Instrument Complexity | High (Requires thermocycler with fluorescence) | Low (Can use simple dry bath/block with visual read) |
| Sample Purification Need | Generally required for reliable quantification | Can tolerate some inhibitors (direct sample use possible) |
| Primary Output | Cycle threshold (Ct) / Relative/Absolute Quantification | Time to positive (Tp) / Endpoint turbidity or fluorescence |
Detailed Protocols
Protocol 1: Standardized Two-Step RT-qPCR for Viral Genome Equivalents Objective: To absolutely quantify viral RNA copies per unit volume with high accuracy.
- RNA Isolation: Use a column-based or magnetic bead RNA purification kit. Include a carrier RNA if expected viral load is low. Elute in 30-50 µL of RNase-free water.
- Reverse Transcription: For each sample, combine 8 µL of purified RNA, 1 µL of 50 µM gene-specific reverse primer or 50 ng random hexamers, and 1 µL of 10 mM dNTP mix. Heat to 65°C for 5 min, then chill. Add 4 µL of 5x RT buffer, 1 µL of RNase inhibitor (40 U/µL), 1 µL of reverse transcriptase (200 U/µL), and 4 µL of nuclease-free water. Incubate: 25°C for 10 min (if using random primers), 50°C for 50 min, 85°C for 5 min. Hold at 4°C.
- qPCR Setup: Prepare a master mix per reaction: 10 µL of 2x probe-based qPCR master mix, 0.8 µL each of 10 µM forward and reverse primer, 0.4 µL of 10 µM hydrolysis probe, 4 µL of nuclease-free water. Add 4 µL of cDNA template. Run in triplicate.
- Thermocycling: 95°C for 3 min; 45 cycles of 95°C for 15 sec, 60°C for 1 min (acquire fluorescence). Use a standard curve from serially diluted, quantified in vitro transcribed RNA for absolute quantification.
Protocol 2: One-Step RT-LAMP for Rapid Viral Detection Objective: To rapidly detect the presence of viral RNA with minimal equipment.
- Reaction Setup: Prepare a master mix on ice per reaction:
- 12.5 µL of 2x LAMP reaction buffer
- 1 µL of 10x LAMP primer mix (F3, B3, FIP, BIP, LF, LB)
- 1 µL of 8 U/µL Bst DNA polymerase (or similar)
- 0.5 µL of 10 U/µL reverse transcriptase
- 2 µL of template RNA (purified or directly from lysed sample)
- 8 µL of nuclease-free water
- Amplification: Incubate reaction at 63°C for 30-45 minutes in a heat block or water bath.
- Detection:
- Visual: Include 1 µL of 10x SYBR Green I or a visible dye like hydroxynaphthol blue (HNB) in the master mix. Positive = color change from violet to blue (HNB) or orange to green (SYBR Green under UV).
- Real-time Turbidity/Fluorescence: Monitor in a real-time isothermal fluorometer or turbidimeter; plot time to positive (Tp).
Visualizations
Title: Decision Workflow: Viral RNA Analysis Paths
Title: RT-LAMP Mechanism: Primer-Driven Isothermal Amplification
The Scientist's Toolkit: Research Reagent Solutions
Table 2: Essential Reagents for RT-qPCR and RT-LAMP Workflows
| Reagent / Material | Function in Viral RNA Research | Example Use Case |
|---|---|---|
| Nucleic Acid Purification Kit | Isolates intact viral RNA from complex samples (swabs, serum). Removes PCR inhibitors. | Initial sample prep for both RT-qPCR and RT-LAMP. |
| DNase/RNase Inhibitors | Protects RNA from degradation during isolation and prevents genomic DNA contamination. | Added to lysis or elution buffers. |
| Bst DNA Polymerase (Large Fragment) | The core enzyme for LAMP. Has high strand displacement activity at constant temperature. | RT-LAMP amplification step. |
| WarmStart RTx Reverse Transcriptase | Thermostable, allows robust cDNA synthesis at higher temperatures, improving specificity. | Reverse transcription in presence of structured RNA. |
| Probe-based qPCR Master Mix | Contains hot-start Taq polymerase, dNTPs, buffers, and optimized Mg2+ for sensitive quantification. | Fluorogenic probe-based detection in RT-qPCR. |
| LAMP Primer Mix (6 primers) | Specifically designed to recognize 6-8 distinct regions on the target viral genome for high specificity. | Target-specific amplification in RT-LAMP. |
| SYBR Green I / HNB Dye | Intercalating dyes for visual or fluorescent detection of amplification products. | Endpoint detection in RT-LAMP. |
| In Vitro Transcribed RNA Standard | Precisely quantified RNA transcript for generating standard curves in absolute quantification. | Determining genome copies/mL in RT-qPCR. |
| Internal Control RNA | Non-target RNA spiked into samples to monitor extraction and amplification efficiency. | Process control for diagnostic assays. |
Abstract Within the broader thesis on optimizing RNA isolation and reverse transcription quantitative PCR (RT-qPCR) for the absolute quantification of viral genome equivalents, this application note details a critical validation and discovery pipeline. RT-qPCR, while highly sensitive, is susceptible to off-target amplification and primer/probe mismatches caused by evolving viral sequences. This protocol integrates Next-Generation Sequencing (NGS) to empirically validate RT-qPCR assay specificity and concurrently discover sequence variants that may affect quantification accuracy, thereby strengthening the foundational research for virology and antiviral drug development.
Application Notes
1. The Necessity of NGS Validation in qPCR Assays RT-qPCR is the cornerstone of viral load quantification. However, its accuracy is predicated on perfect primer and probe complementarity to the target sequence. Sequence drift, especially in RNA viruses, can lead to:
- Under-quantification due to reduced amplification efficiency.
- False negatives from complete primer/probe failure.
- Apparent specificity but amplification of homologous regions or host genes, leading to overestimation.
NGS provides an unbiased survey of the amplified product, confirming that the qPCR signal originates exclusively from the intended target and revealing the exact sequence context of the primer/probe binding sites.
2. Synergistic Workflow for Validation and Discovery The integrated workflow begins with standard RT-qPCR amplification of viral RNA isolates. The amplicons, rather than just yielding a quantification cycle (Cq) value, are then subjected to NGS library preparation and sequencing. Bioinformatic analysis serves a dual purpose:
- Specificity Validation: Mapping reads to reference genomes to confirm amplicon identity.
- Variant Discovery: Identifying single nucleotide polymorphisms (SNPs) or insertions/deletions (indels) within primer and probe regions.
Table 1: Comparative Output of RT-qPCR vs. Integrated NGS Analysis
| Parameter | RT-qPCR Alone | RT-qPCR + NGS Integration |
|---|---|---|
| Primary Output | Quantification Cycle (Cq), Amplification Curve | Cq + Exact Amplicon DNA Sequence |
| Specificity Check | Inferred (melting curve, probe detection) | Empirical (direct sequence readout) |
| Variant Detection | Indirect (altered Cq, failed amplification) | Direct (base-by-base identification in amplicon) |
| Off-target Detection | Limited to non-specific amplification products | High-resolution identification of all amplified sequences |
| Data Output | Quantitative (Cq, copies/µL) | Quantitative + Qualitative (Variant frequency, % of reads) |
Table 2: Example NGS-Based Discovery of Sequence Variants in a Hypothetical SARS-CoV-2 qPCR Assay (N Gene Target)
| Genomic Position | Reference Base | Discovered Variant | Variant Frequency | Location | Potential Impact on qPCR |
|---|---|---|---|---|---|
| 29140 | C | T | 12.5% | Forward Primer 3' end | Major: Possible reduction in efficiency |
| 29197 | A | G | 99.8% | Probe binding region | Critical: May quench probe signal, cause under-quantification |
| 29232 | T | C | 0.7% | Reverse Primer middle | Minor: Likely negligible impact |
Detailed Protocols
Protocol 1: Post-qPCR Amplicon Purification and NGS Library Preparation
Objective: To purify RT-qPCR products and prepare them for NGS sequencing.
Materials: See "The Scientist's Toolkit" below.
Method:
- RT-qPCR Amplification: Perform RT-qPCR on extracted viral RNA using your standard assay. Include no-template controls (NTC) and positive controls.
- Post-PCR Purification:
- Combine replicate qPCR reactions for each sample.
- Use a magnetic bead-based clean-up system (e.g., AMPure XP) following manufacturer guidelines at a 0.8x beads-to-sample ratio to remove primers, dNTPs, and enzyme.
- Elute purified amplicons in 20-30 µL of nuclease-free water. Quantify using a fluorometer.
- Library Preparation (Tagmentation-Based):
- Using the purified amplicon as input, proceed with a tagmentation-based library prep kit (e.g., Illumina DNA Prep).
- Tagmentation: Incubate amplicon DNA with the tagmentation enzyme (blending transposase) to fragment and simultaneously add adapter sequences.
- PCR Amplification: Perform a limited-cycle (5-8 cycles) PCR using unique dual index primers to amplify the libraries and add full adapter sequences with sample-specific barcodes.
- Library Clean-up: Perform a final 0.9x magnetic bead clean-up to remove excess primers and select for optimal fragment size (~300-500 bp).
- Library QC and Pooling:
- Assess library concentration via qPCR (e.g., KAPA Library Quantification Kit) and fragment size distribution via bioanalyzer or tapestation.
- Pool equimolar amounts of each uniquely indexed library.
- Sequencing: Denature and dilute the pooled library according to sequencer specifications (e.g., Illumina MiSeq or iSeq). Use a 2x150 bp or 2x250 bp paired-end run for sufficient overlap and high-quality consensus sequence.
Protocol 2: Bioinformatic Analysis for Specificity and Variant Calling
Objective: To analyze NGS data to validate amplicon identity and call variants within primer/probe regions.
Primary Tools: FASTQC, BWA-MEM, SAMtools, bcftools, IGV. Workflow:
- Quality Control: Run
FASTQCon raw sequencing reads (.fastqfiles). Trim low-quality bases and adapter sequences usingTrimmomatic. - Alignment to Reference:
- Index the target viral genome reference sequence (
.fasta). - Align trimmed reads to the reference using
BWA-MEM:bwa mem -t 4 reference.fasta sample_R1.fastq sample_R2.fastq > sample.sam - Convert SAM to BAM, sort, and index using
SAMtools:
- Index the target viral genome reference sequence (
- Specificity Assessment: Visualize the aligned reads in
Integrative Genomics Viewer (IGV). Confirm dense, contiguous read coverage strictly across the expected amplicon region. Check for significant off-target coverage elsewhere in the genome or host sequence. - Variant Calling:
- Generate a pileup and call variants using
bcftools: - Filter the VCF file for variants within the genomic coordinates of your qPCR primer and probe binding sites.
- Calculate variant frequency from the VCF data (ALTDP / (REFDP + ALT_DP)).
- Generate a pileup and call variants using
The Scientist's Toolkit: Research Reagent Solutions
| Item | Function |
|---|---|
| High-Fidelity DNA Polymerase (for qPCR) | Provides accurate amplification with low error rates, crucial for downstream sequencing. |
| AMPure XP Beads | Magnetic beads for size-selective purification of PCR amplicons and NGS libraries. |
| Illumina DNA Prep Kit | Integrated, tagmentation-based library preparation for efficient, parallel sample processing. |
| IDT for Illumina DNA/RNA UD Indexes | Unique dual indexes for multiplexing samples, reducing index hopping cross-talk. |
| KAPA Library Quantification Kit (qPCR) | Accurate absolute quantification of sequencing-ready libraries for precise pooling. |
| Agilent High Sensitivity D1000 ScreenTape | For quality control of final NGS library fragment size distribution. |
| NEBNext Ultra II Q5 Master Mix | Alternative high-fidelity PCR mix for library amplification. |
| Zymo Research Viral RNA Clean & Concentrator | For initial concentration of low-titer viral RNA samples prior to RT-qPCR. |
Visualization: Experimental and Analytical Workflow
Title: Integrated NGS Validation Workflow for qPCR
Title: NGS Data Analysis Pipeline for qPCR Validation
Conclusion
Accurate quantification of viral genome equivalents via RNA isolation and RT-qPCR remains a cornerstone technique in virology, drug development, and clinical diagnostics. Mastering the foundational principles, adhering to robust methodological protocols, proactively troubleshooting issues, and rigorously validating data are all non-negotiable for generating reliable results. As the field evolves, techniques like digital PCR offer even greater precision, while isothermal methods provide rapid screening. The future lies in integrating these complementary technologies—using qPCR for high-throughput quantification, dPCR for absolute low-copy number validation, and NGS for comprehensive variant analysis. This multi-method approach will be critical for responding to emerging pathogens, developing targeted antivirals and vaccines, and advancing personalized medicine based on precise viral load monitoring.