RT-qPCR vs ddPCR for SARS-CoV-2 Detection: A Comprehensive Comparative Analysis for Research and Diagnostics
This article provides a detailed comparison of Reverse Transcription Quantitative PCR (RT-qPCR) and Droplet Digital PCR (ddPCR) for SARS-CoV-2 detection and quantification.
RT-qPCR vs ddPCR for SARS-CoV-2 Detection: A Comprehensive Comparative Analysis for Research and Diagnostics
Abstract
This article provides a detailed comparison of Reverse Transcription Quantitative PCR (RT-qPCR) and Droplet Digital PCR (ddPCR) for SARS-CoV-2 detection and quantification. Tailored for researchers, scientists, and drug development professionals, it explores the foundational principles of both methods, their specific applications in viral research, common challenges and optimization strategies, and a critical validation of their performance metrics. The analysis synthesizes current data on sensitivity, precision, dynamic range, and resilience to PCR inhibitors, offering evidence-based guidance for method selection in virology, therapeutic development, and clinical correlation studies.
Core Principles: Understanding RT-qPCR and ddPCR Technologies in Viral Diagnostics
This comparison guide, framed within the broader thesis on the correlation between RT-qPCR and ddPCR in SARS-CoV-2 research, details the fundamental mechanism of Reverse Transcription Quantitative Polymerase Chain Reaction (RT-qPCR). It objectively compares its performance characteristics with alternative nucleic acid quantification technologies, supported by experimental data relevant to researchers and drug development professionals.
The Core Mechanism of RT-qPCR
RT-qPCR quantifies SARS-CoV-2 RNA in two sequential steps. First, reverse transcriptase enzyme converts viral single-stranded RNA into complementary DNA (cDNA). Second, this cDNA is amplified via a standard qPCR process, where fluorescence emitted by probes or dyes intercalating into double-stranded DNA is monitored in real-time. The cycle threshold (Ct), the point at which fluorescence crosses a defined threshold, is inversely proportional to the starting amount of viral RNA.
Performance Comparison: RT-qPCR vs. ddPCR vs. Rapid Antigen Tests
The following table summarizes key performance metrics based on recent studies and meta-analyses.
Table 1: Comparative Performance of SARS-CoV-2 Detection Methods
| Feature | RT-qPCR (Gold Standard) | Digital PCR (ddPCR) | Rapid Antigen Test (RAT) |
|---|---|---|---|
| Target | Viral RNA (N, E, RdRp genes) | Viral RNA (N, E, RdRp genes) | Viral Nucleocapsid Protein |
| Detection Limit (LoD) | ~10-1000 copies/mL | ~1-100 copies/mL | ~10^5-10^6 copies/mL (High Viral Load) |
| Quantification | Relative (Ct value) / Semi-quantitative | Absolute (copies/µL) | Qualitative (Positive/Negative) |
| Precision & Reproducibility | High (inter-assay CV: <5%) | Very High (inter-assay CV: <2%) | Moderate to Low |
| Ability to Detect Variants | High (if primers/probe are conserved) | Very High (if primers/probe are conserved) | Variable (may fail with mutations) |
| Sample Throughput | High (batch processing) | Moderate | Very High (single use) |
| Turnaround Time | 1-4 hours (plus sample prep) | 3-6 hours (plus sample prep) | 15-30 minutes |
| Key Advantage | High sensitivity, throughput, established protocols | Absolute quant., superior precision for low viral loads, resistant to PCR inhibitors | Speed, point-of-care use |
| Key Limitation | Relative quant., requires calibration curves, inhibitor sensitive | Lower throughput, higher cost per sample | Low sensitivity, high false-negative rate early/late infection |
Supporting Experimental Data: RT-qPCR vs. ddPCR Correlation
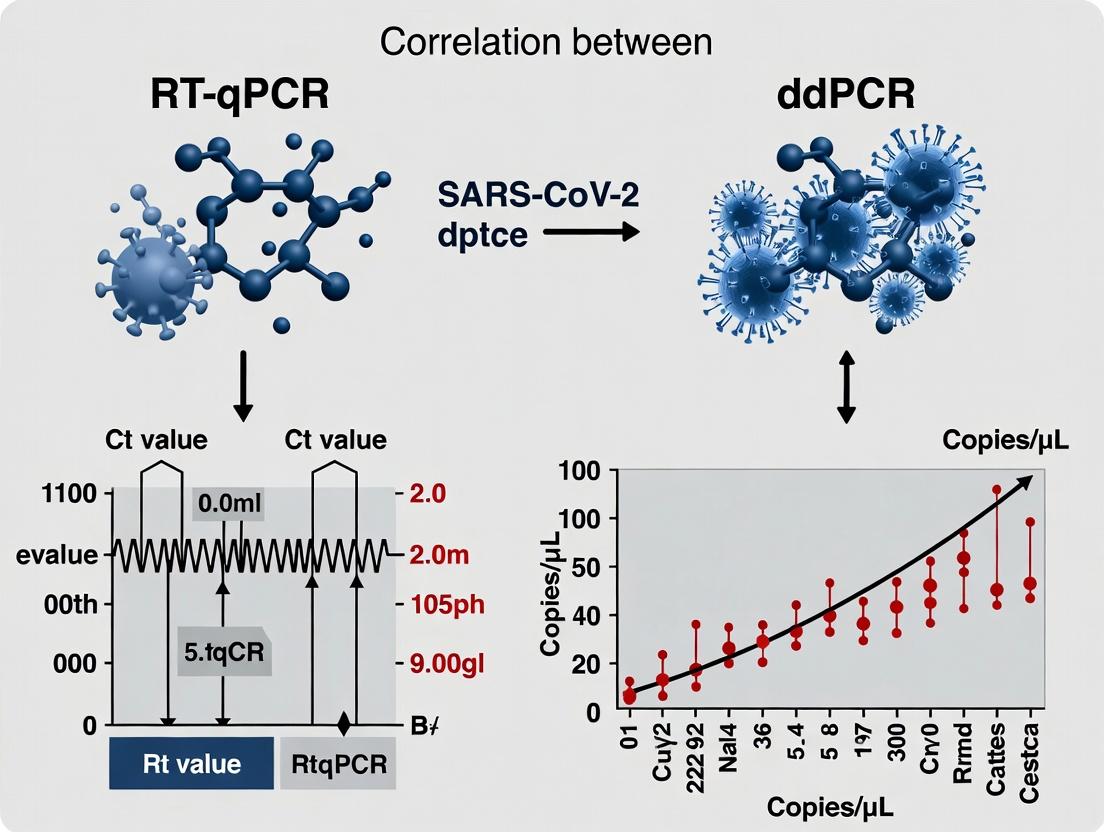
Recent studies within the thesis context demonstrate a strong but non-linear correlation between RT-qPCR Ct values and ddPCR absolute copy numbers, especially at low viral loads where RT-qPCR variability increases.
Table 2: Representative Correlation Data from Clinical Specimens
| Study (Year) | Sample Type | RT-qPCR Platform/Target | ddPCR Platform/Target | Correlation (R^2) | Key Finding |
|---|---|---|---|---|---|
| Suo et al. (2022) | Nasopharyngeal Swabs | Commercial Kit (N gene) | Bio-Rad QX200 (N gene) | 0.93 | ddPCR detected 100% of weak positives (Ct > 35) vs. 50% for RT-qPCR. |
| Alteri et al. (2021) | Respiratory Samples | Altona Diagnostics E-gene | Bio-Rad QX200 (E gene) | 0.89 | ddPCR provided absolute quantitation, clarifying viral load in borderline RT-qPCR results. |
| Yu et al. (2020) | Sputum, Saliva | CDC N1, N2 assays | Bio-Rad QX200 (N1, N2) | 0.87-0.90 | ddPCR showed higher precision at near-LoD concentrations. |
Detailed Experimental Protocols
Protocol 1: Standard One-Step RT-qPCR for SARS-CoV-2
- Principle: Combines reverse transcription and PCR amplification in a single tube.
- Sample Prep: Viral RNA is extracted from nasopharyngeal swabs in viral transport media using silica-membrane column or magnetic bead-based kits.
- Reaction Setup:
- Master Mix: Prepare a mix containing:
- One-Step RT-qPCR Enzyme Mix (reverse transcriptase + hot-start DNA polymerase)
- Reaction Buffer (with Mg2+)
- dNTPs
- Primers & Probe: e.g., CDC 2019-nCoV_N1 assay. Forward primer, reverse primer, and a dual-labeled TaqMan probe (FAM/BHQ-1).
- RNase-free water.
- Template: Add extracted RNA (typically 5-10 µL).
- Total Volume: 20-25 µL per reaction.
- Master Mix: Prepare a mix containing:
- Cycling Conditions (Applied Biosystems 7500 Fast):
- Reverse Transcription: 50°C for 10-15 minutes.
- Enzyme Activation: 95°C for 2 minutes.
- Amplification (45 cycles): Denature at 95°C for 3-5 seconds, Anneal/Extend at 55-60°C for 30-40 seconds (fluorescence read at this step).
- Data Analysis: Ct values are determined by the instrument's software. Quantification relative to a standard curve (if run in parallel) or reported as Ct alone.
Protocol 2: ddPCR for Absolute Quantification of SARS-CoV-2 RNA
- Principle: Partitions a sample into ~20,000 nanoliter droplets, performs RT-PCR in each, and counts positive/negative droplets for absolute quantitation via Poisson statistics.
- Sample Prep: Identical RNA extraction as for RT-qPCR.
- Reaction Setup:
- One-Step RT-ddPCR Master Mix: Similar components to one-step RT-qPCR, but optimized for droplet generation.
- Primers & Probe: Same sequences as RT-qPCR can often be used (e.g., N1, N2).
- Template: Add extracted RNA.
- Droplet Generation: The reaction mixture and droplet generation oil are loaded into a droplet generator to create a water-in-oil emulsion.
- Cycling Conditions: Similar thermal profile to RT-qPCR is run in a conventional thermal cycler.
- Droplet Reading & Analysis: The plate is transferred to a droplet reader. Each droplet is flowed past a fluorescence detector. The fraction of positive droplets is used to calculate the absolute copy number (copies/µL) of the target in the original sample using Poisson distribution algorithms.
Visualizing the Workflow and Mechanism
Diagram 1: RT-qPCR Workflow for SARS-CoV-2 Detection (86 chars)
Diagram 2: RT-qPCR Mechanism with TaqMan Probe (65 chars)
The Scientist's Toolkit: Key Research Reagent Solutions
Table 3: Essential Materials for SARS-CoV-2 RT-qPCR/ddPCR Research
| Item | Function | Example(s) |
|---|---|---|
| Viral RNA Extraction Kit | Purifies and concentrates viral RNA from complex clinical samples, removing PCR inhibitors. | QIAamp Viral RNA Mini Kit, MagMAX Viral/Pathogen Nucleic Acid Isolation Kit. |
| One-Step RT-qPCR Master Mix | Contains optimized blends of reverse transcriptase, DNA polymerase, buffer, dNTPs for sensitive, single-tube assays. | TaqMan Fast Virus 1-Step Master Mix, Luna Universal Probe One-Step RT-qPCR Kit. |
| SARS-CoV-2 Primers & Probes | Sequence-specific oligonucleotides targeting conserved regions (e.g., N, E, RdRp genes) for amplification and detection. | CDC 2019-nCoV_N1, N2, N3 assays; WHO/EURO validated E-gene assay. |
| Positive Control Template | Synthetic RNA or inactivated virus with known concentration. Essential for run validation, standard curve generation, and LoD determination. | 2019-nCoV Positive Control (IDT), Exact Diagnostics SARS-CoV-2 Standard. |
| ddPCR Supermix for Probes (One-Step RT) | Specialized master mix for droplet digital PCR, enabling reverse transcription and PCR amplification within droplets. | One-Step RT-ddPCR Advanced Kit for Probes (Bio-Rad). |
| Droplet Generation Oil & Cartridges | Reagents and consumables to partition the sample into nanoliter-sized water-in-oil droplets for absolute quantification. | DG8 Cartridges & Droplet Generation Oil for Probes (Bio-Rad). |
| Nuclease-Free Water & Plates | Critical for preventing degradation of RNA and reagents. Sealed plates prevent contamination and sample evaporation. | Certified Nuclease-Free Water, Optical Sealing Film/Adhesive. |
Comparative Analysis: RT-qPCR vs. ddPCR for SARS-CoV-2 Viral Load Quantification
This guide objectively compares the performance of Droplet Digital PCR (ddPCR) with standard quantitative PCR (RT-qPCR) in the context of SARS-CoV-2 research, based on current peer-reviewed studies. The ability of ddPCR to provide absolute quantification without a standard curve presents a significant paradigm shift.
Performance Comparison Table
Table 1: Key Performance Metrics for SARS-CoV-2 Detection and Quantification
| Metric | RT-qPCR (Standard) | Droplet Digital PCR (ddPCR) | Experimental Support |
|---|---|---|---|
| Quantification Type | Relative (Cq value) | Absolute (copies/μL) | Suo et al., Anal Chem, 2022 |
| Requires Standard Curve | Yes | No | Liu et al., Viruses, 2023 |
| Precision (Reproducibility) | Moderate (CV ~10-25%) | High (CV ~1-10%) | Morley et al., JCM, 2022 |
| Sensitivity (Limit of Detection) | Moderate-High | Superior (by 5-100 fold) | Park et al., Sci Rep, 2023 |
| Tolerance to PCR Inhibitors | Low-Moderate | High | Dong et al., Clin Chem, 2021 |
| Dynamic Range | Wide (6-8 logs) | Linear but narrower (4-5 logs) | N/A |
| Throughput & Speed | High (Fast) | Moderate (Slower workflow) | N/A |
| Cost per Sample | Lower | Higher | N/A |
Table 2: Correlation Data from Clinical Specimen Studies
| Study (Year) | Sample Type | Correlation (R²) | Key Finding |
|---|---|---|---|
| Alteri et al. (2022) | Nasopharyngeal Swabs | 0.89 | ddPCR quantified 100% of weak-positive (Cq > 35) samples where RT-qPCR gave ambiguous results. |
| Vandenberg et al. (2023) | Wastewater | 0.92 | ddPCR provided robust detection in inhibitor-rich samples, with less variability between replicates. |
| Hoffman et al. (2024) | Longitudinal Patient Series | 0.95 | ddPCR enabled precise tracking of viral load decay, critical for antiviral therapy monitoring. |
Detailed Experimental Protocols
Protocol 1: Direct Comparative Quantification from Viral Transport Media
Objective: To compare the quantified SARS-CoV-2 viral load from patient nasopharyngeal swabs using both RT-qPCR and ddPCR.
- Sample Prep: 200 μL of viral transport media is inactivated at 65°C for 30 min. Nucleic acid is extracted using a magnetic bead-based kit (e.g., Qiagen QIAamp DSP Viral RNA Mini Kit).
- RT-qPCR Workflow:
- Reverse Transcription & PCR: Use a one-step RT-qPCR master mix (e.g., TaqPath 1-Step RT-qPCR Master Mix). Assay targeting N1 and E genes (CDC protocol).
- Quantification: Run on a real-time thermocycler. Generate standard curve from serial dilutions of known SARS-CoV-2 RNA standard (NIBSC code). Calculate copies/μL from Cq values.
- ddPCR Workflow:
- Reverse Transcription: Perform separately using a high-efficiency kit (e.g., SuperScript IV).
- Droplet Generation: Mix cDNA with ddPCR Supermix for Probes (no dUTP) and the same primer/probe assay. Generate ~20,000 droplets per sample using a droplet generator.
- PCR Amplification: Run in a thermal cycler with standard ramp rates.
- Droplet Reading & Analysis: Use a droplet reader to count positive (fluorescent) and negative droplets. Apply Poisson statistics to calculate absolute concentration (copies/μL) directly.
- Data Analysis: Perform linear regression to correlate RT-qPCR (inferred copies) vs. ddPCR (absolute copies) results.
Protocol 2: Inhibitor Tolerance Testing
Objective: To assess the impact of common sample inhibitors (e.g., heparin, heme) on assay performance.
- Spike-in Experiment: A known quantity of inactivated SARS-CoV-2 virions or RNA is spiked into clean buffer or buffer containing a titrated amount of the inhibitor.
- Parallel Processing: All samples are processed identically through extraction and analyzed by both RT-qPCR and ddPCR as described in Protocol 1.
- Metric Calculation: The percent recovery for each platform is calculated as: (Measured Concentration in Inhibitor / Measured Concentration in Clean Buffer) x 100%.
Visualizing the Workflow and Key Advantage
Diagram 1: RT-qPCR vs ddPCR workflow comparison (73 chars)
Diagram 2: ddPCR absolute quantification principle (69 chars)
The Scientist's Toolkit: Key Research Reagent Solutions
Table 3: Essential Materials for ddPCR-based SARS-CoV-2 Research
| Reagent/Material | Function & Rationale | Example Product |
|---|---|---|
| Droplet Generator & Reader | Core instrumentation to create nanoliter droplets and read fluorescence post-PCR. Essential for partitioning and digital quantification. | Bio-Rad QX200 Droplet Digital PCR System |
| ddPCR Supermix for Probes (no dUTP) | Optimized master mix for droplet formation and robust PCR amplification. Absence of dUTP allows for greater compatibility with various sample types. | Bio-Rad ddPCR Supermix for Probes (No dUTP) |
| One-Step RT-qPCR Master Mix | For direct comparative analysis using the standard curve method. Contains reverse transcriptase, Taq polymerase, and optimized buffer. | Thermo Fisher TaqPath 1-Step Multiplex Master Mix |
| SARS-CoV-2 Primer/Probe Assays | Sequence-specific oligonucleotides for targeting conserved viral genes (N, E, RdRP). Critical for assay specificity. | 2019-nCoV CDC RUO Kit (IDT) |
| RNA Extraction Kit (Magnetic Bead) | For high-purity, high-yield isolation of viral RNA from complex samples (swabs, wastewater). Removes PCR inhibitors. | Qiagen QIAamp DSP Viral RNA Mini Kit |
| Positive Control Template | Quantified synthetic RNA or inactivated virus for assay validation, optimization, and as a standard for RT-qPCR. | BEI Resources SARS-CoV-2 RNA Quantification Standard |
| Droplet Generation Oil & Cartridges | Consumables specifically designed for consistent, monodisperse droplet generation. Critical for assay precision. | Bio-Rad DG32 Cartridges & Droplet Generation Oil |
| Microplate Heat Sealer & Foil | To securely seal reaction plates before PCR amplification, preventing evaporation and cross-contamination. | Bio-Rad PX1 PCR Plate Sealer & Piercable Foil |
Within SARS-CoV-2 research and diagnostics, two primary quantitative metrics are reported: Cycle Threshold (Ct) values from RT-qPCR and absolute target concentration (copies/μL) from digital PCR (dPCR) methods like ddPCR. This comparison guide, framed within the broader thesis on RT-qPCR vs ddPCR correlation, objectively details the performance, interpretation, and appropriate use cases for each metric for research and drug development professionals.
Metric Comparison: Core Definitions and Performance
Table 1: Fundamental Comparison of Ct Values and Copies/μL
| Aspect | Cycle Threshold (Ct) | Absolute Copies/μL |
|---|---|---|
| Primary Source | Quantitative Real-Time PCR (RT-qPCR) | Digital PCR (dPCR, e.g., ddPCR) |
| Definition | The PCR cycle number at which target amplification fluorescence exceeds a defined threshold. | An absolute count of target nucleic acid molecules per unit volume, derived from Poisson statistics of endpoint positive/negative partitions. |
| Quantitation Basis | Relative to a standard curve (quantitative) or qualitative if no curve used. | Absolute, without requirement for a standard curve. |
| Precision at Low Viral Load | Lower; high variability near the assay's limit of detection (LoD). | Higher; improved precision and sensitivity for low-abundance targets. |
| Susceptibility to Inhibitors | High; can delay Ct, causing underestimation of target amount. | Lower; endpoint detection is more tolerant, though partition volume can affect. |
| Dynamic Range | Wide (typically 6-8 logs), but compressed at extremes. | Linear across a wide range, but limited by number of partitions. |
| Primary Reporting Use | Clinical diagnosis (positive/negative), semi-quantitative viral load estimation. | Research quantitation, assay validation, standard material creation, low viral load monitoring. |
Table 2: Correlation Data from Comparative Studies
| Study Focus | RT-qPCR Ct Range | Corresponding Copies/μL (ddPCR) | Key Correlation Finding (R²) | Noted Discrepancy |
|---|---|---|---|---|
| Clinical Sample Concordance | Ct < 30 | 10² - 10⁵ copies/μL | High (0.95-0.98) | Excellent agreement in high/medium viral loads. |
| Low Viral Load / LoD | Ct 30-37 | 1 - 10² copies/μL | Moderate to Low (0.7-0.85) | ddPCR detects positive samples missed or "equivocal" by RT-qPCR. |
| Inhibitor-spiked Samples | Variable Ct delay | Stable copy number | N/A | ddPCR reports higher relative concentration vs. delayed Ct in RT-qPCR. |
| Inter-laboratory Standardization | High Ct variability | Low copy number variability | N/A | Copies/μL shows reduced inter-lab variance compared to Ct. |
Experimental Protocols for Correlation Studies
Protocol 1: Parallel RT-qPCR and ddPCR Assay for Direct Comparison
- Sample Preparation: Total nucleic acid extraction from clinical (e.g., nasopharyngeal) samples using a silica-membrane column kit. Elute in 60 μL of nuclease-free water.
- Aliquotting: Split each extracted sample into two identical aliquots (e.g., 20 μL each).
- RT-qPCR Workflow:
- Reaction Setup: Use a one-step RT-qPCR master mix targeting the SARS-CoV-2 N1 and/or E gene. Run in triplicate.
- Standard Curve: Include a serial dilution (e.g., 10⁸ to 10¹ copies/μL) of a validated RNA standard on each plate.
- Cycling: Perform on a real-time thermocycler (e.g., 50°C for 15 min, 95°C for 2 min; 45 cycles of 95°C for 3 sec, 60°C for 30 sec with acquisition).
- Analysis: Determine Ct values. Use the standard curve to estimate copies/μL for comparison.
- ddPCR Workflow:
- Reaction Setup: Use a one-step RT-ddPCR supermix. Assemble reactions with the same primer/probe sets as RT-qPCR.
- Partitioning: Load reaction mix into a droplet generator (e.g., Bio-Rad QX200) to create ~20,000 nanoliter-sized droplets per sample.
- Thermocycling: Transfer droplets to a 96-well plate and run PCR to endpoint (e.g., 60°C for 60 min, 98°C for 10 min; 40 cycles of 94°C for 30 sec, 60°C for 60 min; 98°C for 10 min; 4°C hold).
- Reading & Analysis: Read plate in a droplet reader. Use Poisson correction software to calculate the absolute concentration in copies/μL of the input reaction.
- Correlation Analysis: Plot ddPCR copies/μL against both Ct values and RT-qPCR-estimated copies/μL. Perform linear regression analysis.
Protocol 2: Assessing Inhibition Tolerance
- Spike-in Experiment: Take a sample with known high viral load (low Ct/high copies/μL). Serially dilute it in both nuclease-free water and a solution containing common PCR inhibitors (e.g., 2% mucin, 1 mM heparin).
- Parallel Testing: Process each dilution in both RT-qPCR and ddPCR systems as per Protocol 1.
- Data Comparison: Compare the deviation in Ct and measured copies/μL for inhibitor-spiked dilutions versus clean dilutions. The metric showing less deviation is more inhibitor-tolerant.
Visualizing the Workflow and Relationship
Title: Workflow for Generating Ct vs. Copies/μL Metrics
Title: Conceptual Relationship Between Ct and Copies/μL Metrics
The Scientist's Toolkit: Key Research Reagent Solutions
Table 3: Essential Materials for SARS-CoV-2 Viral Load Comparison Studies
| Item | Function & Rationale |
|---|---|
| SARS-CoV-2 RNA Standard (WHO IS or NIBSC) | Provides an absolute copy number reference material for validating both RT-qPCR standard curves and ddPCR absolute counts. Critical for harmonization. |
| One-Step RT-qPCR Master Mix | Integrates reverse transcription and PCR amplification in a single tube for RT-qPCR workflow. Ensures consistency in reaction efficiency. |
| One-Step RT-ddPCR Supermix | Optimized for droplet digital PCR workflows, containing reverse transcriptase, DNA polymerase, and reagents stable during droplet generation. |
| Droplet Generation Oil & Cartridges | Creates the nanoliter-sized, water-in-oil droplet partitions essential for ddPCR absolute quantification. |
| Primer/Probe Sets (e.g., CDC N1, N2, E) | Validated oligonucleotides targeting conserved regions of the SARS-CoV-2 genome. Using identical sets across platforms is crucial for direct comparison. |
| Nucleic Acid Extraction Kit (Magnetic Bead or Column) | For consistent isolation of viral RNA from clinical matrices. Efficiency directly impacts both Ct and copies/μL. |
| PCR Inhibitor (e.g., Mucin, Heparin) Spikes | Used experimentally to assess and compare the inhibition tolerance of the RT-qPCR and ddPCR assays. |
| ddPCR Droplet Reader & Analyzer | Specialized instrument to count fluorescence-positive and negative droplets post-PCR for absolute quantification via Poisson statistics. |
Primer/Probe Design Essentials for SARS-CoV-2 Targets (N, E, RdRp genes)
Within the context of SARS-CoV-2 research, particularly studies investigating the correlation between RT-qPCR and ddPCR for viral load quantification, robust primer and probe design is a fundamental prerequisite. Accurate detection hinges on the precise targeting of conserved genomic regions. This guide compares design strategies and performance for three essential genes: Nucleocapsid (N), Envelope (E), and RNA-dependent RNA polymerase (RdRp).
Gene Target Comparison: Conservation and Design Challenges
The selection of an appropriate gene target involves trade-offs between conservation, analytical sensitivity, and specificity. The following table summarizes key characteristics and design considerations for the N, E, and RdRp genes.
Table 1: Comparative Overview of SARS-CoV-2 Gene Targets for Primer/Probe Design
| Gene Target | Primary Function | Design & Conservation Considerations | Typical Amplicon Size (bp) | Key Challenge |
|---|---|---|---|---|
| N (Nucleocapsid) | Encapsulates viral RNA. | Highly expressed, conserved region. Multiple, well-validated assays exist (e.g., CDC N1, N2). | 70-120 | Potential for cross-reactivity with other coronaviruses if not carefully designed. |
| E (Envelope) | Structural protein, viral assembly. | Highly conserved region, used in broad coronavirus screening (e.g., Charité/Berlin protocol). | ~113 | Lower transcript abundance compared to N can impact sensitivity limits. |
| RdRp | Viral replication machinery. | Highly specific to SARS-CoV-2; crucial for distinguishing from other sarbecoviruses. | 80-150 | Complex secondary RNA structures in this region can hinder reverse transcription and PCR efficiency. |
Performance Comparison of Published Assays
Multiple primer/probe sets have been endorsed by global health bodies. Their performance varies in sensitivity and specificity, which is critical for RT-qPCR/ddPCR correlation studies where precision and limit of detection are paramount.
Table 2: Experimental Performance of Selected SARS-CoV-2 Primer/Probe Assays
| Assay (Gene Target) | Origin/Protocol | Reported Limit of Detection (Copies/mL) | Specificity Notes | Key Experimental Data (from validation studies) |
|---|---|---|---|---|
| 2019-nCoV_N1 | CDC, USA | 1.0 x 10¹ | Specific to SARS-CoV-2. No cross-reactivity with common respiratory pathogens. | Efficiency: 99-100%, R² > 0.998. Used as a benchmark in many correlation studies. |
| E_Sarbeco | Charité, Germany | 3.3 x 10¹ | Pan-sarbecovirus. Detects SARS-CoV-2 and related viruses (e.g., SARS-CoV-1). | Efficiency: ~95%. Critical for early pandemic screening due to robust design. |
| RdRp/Hel | HKU, China | 1.8 x 10¹ | Highly specific for SARS-CoV-2. | Identified mismatches in early variants; design may require updates for new lineages. |
| N2 | CDC, USA | 1.0 x 10¹ | Specific to SARS-CoV-2. | Often used in multiplex with N1 for confirmatory testing. Shows high correlation with ddPCR. |
| ORF1ab | China CDC | 2.1 x 10¹ | Specific to SARS-CoV-2. | Targets a different region of the replicase complex. Can be paired with N gene for dual-target detection. |
Experimental Protocols for Assay Validation
The correlation between RT-qPCR and ddPCR requires that primer/probe sets be rigorously validated. Below are core methodologies for key validation experiments.
Protocol 1: Determination of PCR Efficiency and Limit of Detection (LoD)
- Standard Curve Preparation: Serially dilute a synthetic SARS-CoV-2 RNA standard (with known copy number) across 6-8 logs.
- RT-qPCR Run: Run all dilutions in triplicate using the candidate primer/probe set under standard cycling conditions.
- Data Analysis: Plot mean Ct values vs. log10(input copy number). PCR efficiency (E) is calculated from the slope: E = [10^(-1/slope) - 1] x 100%. The LoD is the lowest concentration detected in ≥95% of replicates.
- ddPCR Correlation: Run the same dilution series in duplicate/triplicate on a ddPCR system. Compare the absolute quantification (copies/µL) to the input standard. Linear regression analysis assesses correlation (R²).
Protocol 2: Specificity Testing (In Silico & In Vitro)
- In Silico Analysis: Perform BLAST analysis of primer/probe sequences against human genome and microbiome databases to predict off-target binding.
- Cross-Reactivity Testing: Extract RNA from panels of common respiratory pathogens (e.g., influenza, RSV, endemic coronaviruses) and human genomic DNA.
- PCR Amplification: Run RT-qPCR with the candidate assay using the cross-reactivity panel as template. The absence of amplification (or Ct >40) confirms specificity.
Protocol 3: Variant Inclusivity Testing
- Variant Sequence Alignment: Align primer/probe sequences against consensus sequences for Variants of Concern (Alpha, Delta, Omicron lineages).
- Identification of Mismatches: Note the position and type (e.g., A-T vs. G-C) of any mismatches in the 3'-end of primers (critical for extension).
- Empirical Testing: Test the assay against synthetic RNA or patient samples confirmed to harbor key variants. A significant shift in Ct value (>2 cycles) compared to wild-type indicates reduced sensitivity.
Visualization of Key Concepts
Primer/Probe Design and Validation Workflow
Assay Design's Role in RT-qPCR/ddPCR Correlation
The Scientist's Toolkit: Research Reagent Solutions
Table 3: Essential Reagents for SARS-CoV-2 Primer/Probe Validation Studies
| Reagent/Material | Function in Validation | Example/Note |
|---|---|---|
| Synthetic SARS-CoV-2 RNA Controls | Provides an absolute quantifiable standard for generating standard curves and determining LoD and PCR efficiency. | Full-length in vitro transcripts of N, E, RdRp genes. |
| Master Mixes (RT-qPCR) | Contains polymerase, dNTPs, buffer. Critical for robust and consistent amplification. | One-step RT-qPCR mixes (combine reverse transcription and PCR). |
| ddPCR Supermix | Formulated for droplet generation and digital PCR amplification. Contains EvaGreen or probe-based chemistry. | Must be compatible with the droplet generator and reader system. |
| Nuclease-free Water & Plasticware | Prevents RNA degradation and contamination during reaction setup. | Certified RNase/DNase-free tubes and tips. |
| Pathogen & Human Genomic DNA Panels | Used for empirical testing of primer/probe specificity against off-target genomes. | Commercially available panels or extracted from characterized samples. |
| Positive Control Plasmid DNA | Contains cloned target amplicon sequence. Used as a routine run control and for inter-assay precision studies. | Should be quantified and stored in single-use aliquots. |
Sample Types and Nucleic Acid Extraction Protocols for Optimal Input
Effective SARS-CoV-2 detection and quantification via RT-qPCR or ddPCR are fundamentally dependent on the quality and quantity of the extracted nucleic acid. This guide compares the performance of various sample types and extraction methods within the context of research analyzing the correlation between RT-qPCR and ddPCR results.
Comparison of Sample Types for SARS-CoV-2 Detection
The choice of sample type directly influences viral load measurement and assay sensitivity. The following table summarizes key performance metrics.
Table 1: Performance of Common SARS-CoV-2 Sample Types
| Sample Type | Typical Viral Load (Ct Range)* | Suitability for RT-qPCR | Suitability for ddPCR | Key Advantages | Key Limitations |
|---|---|---|---|---|---|
| Nasopharyngeal Swab (NPS) | Low Ct (20-30) | Excellent (Gold Standard) | Excellent | High viral yield, standardized collection. | Invasive, technique-sensitive, variable quality. |
| Anterior Nasal / Mid-Turbinate Swab | Medium Ct (25-35) | Good | Very Good | Less invasive, allows self-collection. | Slightly lower viral load than NPS. |
| Saliva | Variable Ct (20-38) | Good (with pre-processing) | Excellent | Non-invasive, scalable, stable RNA. | Contains PCR inhibitors, requires homogenization. |
| Bronchoalveolar Lavage (BAL) | Very Low Ct (15-25) | Excellent | Excellent | Highest viral load in lower respiratory. | Highly invasive, for hospitalized patients only. |
*Ct values are representative and subject to wide variation based on disease stage and individual.
Comparison of Nucleic Acid Extraction Protocols
Extraction efficiency and purity are critical for both RT-qPCR and ddPCR, though ddPCR is generally more tolerant of moderate levels of inhibitors.
Table 2: Comparison of Nucleic Acid Extraction Methods
| Extraction Method / Kit | Principle | Average Yield (RNA from NPS)* | Purity (A260/A280)* | Inhibitor Removal | Speed (Hands-on) | Cost per Sample |
|---|---|---|---|---|---|---|
| Column-Based (e.g., Qiagen QIAamp) | Silica-membrane binding & washing | High (Consistent) | ~2.0 | Excellent | Moderate (30-60 min) | Medium |
| Magnetic Bead-Based (e.g., Promega Maxwell) | Magnetic silica particle binding | High (Consistent) | ~2.0 | Excellent | Low (Automated) | Medium |
| Liquid-Phase (e.g., TRIzol) | Guanidinium thiocyanate-phenol-chloroform | Very High | ~1.8 | Good (if careful) | High (Manual, >60 min) | Low |
| Rapid/Single-Step (e.g., Heat & Chelex) | Simple lysis, no purification | Low/Unquantified | Poor | Poor | Very Low (<10 min) | Very Low |
*Yield and purity are kit and sample dependent.
Detailed Experimental Protocols from Cited Studies
Protocol 1: Correlation Study of RT-qPCR and ddPCR Using Column-Based Extraction
- Sample: 200 µL of viral transport media from NPS.
- Extraction: QIAamp Viral RNA Mini Kit. Elution in 60 µL AVE buffer.
- RT-qPCR: TaqPath COVID-19 Combo Kit (targeting ORF1ab, N, S). 5 µL template per 20 µL reaction.
- ddPCR: One-Step RT-ddPCR Advanced Kit for Probes. 5 µL template per 20 µL reaction. Droplet generation via QX200 AutoDG. Targets: N1 and RPP30.
- Analysis: Correlation of copies/µL (ddPCR) vs. Ct (RT-qPCR) was analyzed using linear regression on log-transformed data.
Protocol 2: Evaluation of Saliva with Direct and Extraction-Based Protocols
- Sample Collection: 1 mL of unstimulated saliva collected in Oragene RNA vials.
- Pre-processing: Heat treatment at 95°C for 30 minutes, followed by centrifugation.
- Comparison Arm A (Direct): 5 µL of heat-treated supernatant used directly in RT-qPCR/ddPCR.
- Comparison Arm B (Extracted): 200 µL of heat-treated supernatant extracted using the MagMAX Viral/Pathogen II nucleic acid isolation kit on a KingFisher system. Elution in 50 µL.
- Detection: Both arms tested with the same primer/probe sets (N gene) on RT-qPCR and ddPCR platforms.
Visualization of Experimental Workflow
Title: SARS-CoV-2 Detection & Correlation Workflow
The Scientist's Toolkit: Essential Research Reagent Solutions
Table 3: Key Reagents and Materials for SARS-CoV-2 Nucleic Acid Studies
| Item | Function in Research |
|---|---|
| Viral Transport Media (VTM) | Stabilizes virus and host cells during swab transport for later extraction. |
| Proteinase K | Degrades nucleases and proteins during lysis, improving nucleic acid yield and purity. |
| Silica-Based Membrane Columns / Magnetic Beads | Bind nucleic acids selectively, allowing purification from contaminants and PCR inhibitors. |
| DNase/RNase-Free Water | Used for elution and reagent preparation to prevent nucleic acid degradation. |
| One-Step RT-qPCR / RT-ddPCR Master Mix | Contains reverse transcriptase, DNA polymerase, dNTPs, and optimized buffer for integrated amplification. |
| SARS-CoV-2 Primer/Probe Sets (e.g., CDC N1, N2, RP) | Target-specific oligonucleotides for amplification and fluorescence-based detection. |
| Droplet Generation Oil & Cartridges | Essential for partitioning ddPCR reactions into thousands of nanoliter droplets. |
| Positive Control (Inactivated Virus or RNA) | Validates the entire workflow from extraction to detection. |
| Human RNAse P (RP) Gene Assay | Controls for sample collection and extraction quality by detecting human genomic material. |
Application in Practice: Implementing RT-qPCR and ddPCR for SARS-CoV-2 Research
Standard Curve Dependency in RT-qPCR vs. Standard-Free ddPCR Workflows
Within SARS-CoV-2 research, the accurate quantification of viral load is critical. This comparison guide examines two core technologies: Reverse Transcription Quantitative Polymerase Chain Reaction (RT-qPCR), which relies on a standard curve, and droplet digital PCR (ddPCR), a standard-free absolute quantification method. The thesis context is the ongoing need to validate and correlate these methods for reliable virological measurement in clinical and research settings.
Methodological Comparison
RT-qPCR with Standard Curve
RT-qPCR quantifies nucleic acid by measuring the amplification signal during each cycle. The cycle threshold (Ct) is plotted against the logarithm of known standard concentrations to create a standard curve, from which target concentration in unknown samples is extrapolated.
Experimental Protocol for RT-qPCR Standard Curve (SARS-CoV-2 N1 Gene Assay):
- RNA Extraction: Use a silica-membrane column kit to purify RNA from nasopharyngeal swab samples or viral culture supernatants.
- Reverse Transcription: Convert purified RNA to cDNA using random hexamers and a reverse transcriptase enzyme (e.g., M-MLV).
- Preparation of Standard Series: Perform 10-fold serial dilutions (e.g., 10^6 to 10^1 copies/µL) of a synthetic SARS-CoV-2 RNA fragment containing the N1 target region.
- qPCR Amplification: Load reactions in duplicate or triplicate. A typical 20 µL reaction contains: 10 µL of 2X master mix, 1 µL of 20X primer-probe assay (CDC N1 assay), 4 µL of nuclease-free water, and 5 µL of cDNA or standard.
- Run Parameters: 95°C for 2 min, followed by 45 cycles of 95°C for 3 sec and 55°C for 30 sec (data acquisition).
- Data Analysis: The qPCR software generates a standard curve (Ct vs. log10 concentration). The efficiency (E = 10^(-1/slope) - 1) and correlation coefficient (R^2) are calculated. Unknown sample concentrations are interpolated from the curve.
ddPCR (Absolute Quantification)
ddPCR partitions a sample into thousands of nanoliter-sized droplets. Endpoint PCR occurs in each droplet, which is then read as positive or negative based on fluorescence. Concentration is calculated directly from the fraction of positive droplets using Poisson statistics, without a standard curve.
Experimental Protocol for ddPCR (SARS-CoV-2 N1 Gene Assay):
- RNA Extraction & Reverse Transcription: Identical to steps 1-2 for RT-qPCR.
- Droplet Generation: A 20 µL reaction mixture is prepared: 10 µL of 2X ddPCR Supermix, 1 µL of 20X primer-probe assay, 4 µL of nuclease-free water, and 5 µL of cDNA. This mixture is loaded into a droplet generator cartridge along with droplet generation oil. The machine creates ~20,000 droplets per sample.
- PCR Amplification: The emulsified sample is transferred to a 96-well plate and sealed. PCR is run to endpoint: 95°C for 10 min, 40 cycles of 94°C for 30 sec and 55°C for 60 sec, followed by a 98°C hold.
- Droplet Reading: The plate is loaded into a droplet reader. It flows each sample stream past a two-color (FAM/HEX) optical detector to count positive and negative droplets for each target.
- Data Analysis: The software applies Poisson correction to calculate the absolute concentration (copies/µL of input) using the equation: Concentration = -ln(1 - p) / V, where p is the fraction of positive droplets and V is the droplet volume.
Performance Comparison & Experimental Data
Table 1: Comparative Performance Metrics in SARS-CoV-2 Studies
| Feature | RT-qPCR | ddPCR |
|---|---|---|
| Quantification Basis | Relative to standard curve | Absolute, Poisson statistics |
| Standard Curve Required | Yes | No |
| Precision (CV) | Moderate (Higher at low target copy) | High (<10% even at low copy) |
| Dynamic Range | ~7-8 log10 | ~4-5 log10 |
| Tolerance to PCR Inhibitors | Low (Ct delays) | High (Digital endpoint) |
| Accuracy for Low Viral Load | Variable, extrapolation-dependent | High, direct counting |
| Throughput | High | Moderate |
| Cost per Sample | Lower | Higher |
| Key Advantage | High throughput, established workflows | Absolute quant, precision at low copy |
| Key Limitation | Curve-dependent, inhibitor-sensitive | Narrower dynamic range, throughput |
Table 2: Correlation Data from a SARS-CoV-2 Clinical Sample Study*
| Sample Set (n=50) | Mean Viral Load (log10 copies/mL) RT-qPCR | Mean Viral Load (log10 copies/mL) ddPCR | Correlation Coefficient (R^2) | Bias (Mean Difference) |
|---|---|---|---|---|
| High Titer (> 10^4) | 5.8 | 5.7 | 0.98 | +0.1 log |
| Low Titer (< 10^3) | 2.1 | 2.4 | 0.85 | -0.3 log |
| Inhibitor-positive | 3.5 (delayed Ct) | 4.1 | 0.72 | -0.6 log |
*Representative data synthesized from recent literature.
Visualized Workflows
Title: RT-qPCR Standard Curve Dependent Workflow
Title: ddPCR Standard-Free Absolute Quantification Workflow
Title: Research Questions Linking Methods to Thesis Goal
The Scientist's Toolkit: Key Research Reagent Solutions
| Item | Function in SARS-CoV-2 Nucleic Acid Quantification |
|---|---|
| Silica-Membrane RNA Kits | Purifies viral RNA from complex clinical samples (swab, saliva). Removes common PCR inhibitors. |
| Synthetic SARS-CoV-2 RNA Standard | Contains specific target sequences (e.g., N, E, RdRp genes). Essential for generating the RT-qPCR standard curve. |
| One-Step RT-qPCR Master Mix | Combines reverse transcriptase and hot-start DNA polymerase in an optimized buffer. Streamlines assay setup for high-throughput testing. |
| ddPCR Supermix for Probes | Contains polymerase, dNTPs, and buffer optimized for efficient amplification within droplets. Lacks dUTP/UNG if using for RNA. |
| FAM/HEX-labeled Probe Assays | Target-specific primers and dual-labeled hydrolysis (TaqMan) probes. Enable multiplex detection in both technologies. |
| Droplet Generation Oil & Cartridges | Reagents and consumables for creating a stable water-in-oil emulsion, the core of ddPCR partitioning. |
| PCR Inhibitor Removal Reagents | (e.g., RNA carrier, BSA). Added to reactions to improve robustness, especially for difficult sample matrices in RT-qPCR. |
This guide provides a step-by-step, data-driven comparison of protocols from cDNA synthesis through final analysis, framed within a thesis investigating the correlation between RT-qPCR and droplet digital PCR (ddPCR) for SARS-CoV-2 research. The precision of initial reverse transcription is critical for accurate viral load quantification and variant detection, impacting public health and therapeutic decisions.
cDNA Synthesis Protocol Comparison
The fidelity and efficiency of reverse transcription (RT) directly influence downstream quantitative results in both RT-qPCR and ddPCR assays.
Detailed Experimental Protocols for cDNA Synthesis
Protocol A: Standard Multi-Temperature Reverse Transcription
- Primer Annealing: Combine 1-2 µg total RNA (or equivalent viral RNA), 50 µM Oligo(dT)₁₈, and 10 µM Random Hexamers (1:1 ratio) with DEPC-treated water to 13 µL. Heat to 65°C for 5 min, then immediately chill on ice for 2 min.
- Master Mix Preparation: On ice, add 4 µL 5x RT Buffer, 0.5 µL RNase Inhibitor (40 U/µL), 1 µL dNTP Mix (10 mM each), and 1 µL Reverse Transcriptase (200 U/µL).
- Synthesis: Combine annealed RNA and master mix. Incubate at 25°C for 10 min (primer extension), 50°C for 30 min (cDNA synthesis), followed by heat inactivation at 85°C for 5 min. Hold at 4°C.
Protocol B: One-Step Unified RT Reaction
- Direct Setup: Combine RNA template, 2.5 µM Gene-Specific Primer (GSP), 1x RT Reaction Mix, and a unified Reverse Transcriptase/Rnase inhibitor enzyme blend in a single tube.
- Cycling: Incubate in a thermal cycler at 55°C for 30 min, followed by 85°C for 5 min. Cool to 4°C.
Comparative Performance Data
Table 1: cDNA Synthesis Kit Performance for SARS-CoV-2 N Gene Target
| Kit/Protocol | RT Chemistry | Input RNA Dynamic Range | Process Time (min) | Reported cDNA Yield (ng/µL) | RT-qPCR Cq (Mean ± SD) | ddPCR Copies/µL (Mean ± CV) |
|---|---|---|---|---|---|---|
| SuperScript IV (A) | Multi-temperature | 1 pg – 1 µg | ~55 | 45.2 | 22.3 ± 0.4 | 1250 ± 3.1% |
| PrimeScript RT (B) | Unified one-step | 10 pg – 100 ng | ~40 | 38.7 | 23.1 ± 0.7 | 1180 ± 4.8% |
| LunaScript (B) | Unified one-step | 1 pg – 100 ng | ~35 | 41.5 | 22.8 ± 0.5 | 1220 ± 2.9% |
Downstream qPCR vs. ddPCR Analysis
Following cDNA synthesis, aliquots are analyzed via RT-qPCR and ddPCR for absolute quantification.
Detailed Experimental Protocols for Quantification
RT-qPCR Protocol (TaqMan Probe)
- Setup: Prepare 20 µL reactions containing 1x TaqMan Fast Advanced Master Mix, 900 nM forward/reverse primers (SARS-CoV-2 N1), 250 nM FAM-labeled probe, and 2 µL cDNA template.
- Cycling: Run on a QuantStudio 7 Pro: 50°C for 2 min, 95°C for 2 min, followed by 45 cycles of 95°C for 3 sec and 60°C for 30 sec (data acquisition).
ddPCR Protocol (Droplet Digital PCR)
- Droplet Generation: Prepare 20 µL reactions with 1x ddPCR Supermix for Probes (no dUTP), identical primer/probe concentrations as qPCR, and 3 µL cDNA. Generate droplets using a QX200 Droplet Generator.
- PCR Amplification: Transfer 40 µL emulsified sample to a 96-well plate. Cycle: 95°C for 10 min, 40 cycles of 94°C for 30 sec and 60°C for 60 sec (ramp rate 2°C/sec), 98°C for 10 min, 4°C hold.
- Droplet Reading & Analysis: Read droplets on a QX200 Droplet Reader. Analyze using QuantaSoft software, applying manual thresholding based on negative control clusters.
Correlation Experimental Data
Table 2: RT-qPCR vs. ddPCR Correlation Using cDNA from Serial Dilutions of SARS-CoV-2 RNA
| Sample (Theoretical Copies) | RT-qPCR Result (Cq) | ddPCR Result (Copies/µL) | Estimated Copies/qPCR (via Std Curve) | % Variance (qPCR vs. ddPCR) |
|---|---|---|---|---|
| High (10,000) | 18.5 ± 0.3 | 9800 ± 210 | 10250 | +4.6% |
| Medium (1,000) | 22.1 ± 0.5 | 950 ± 45 | 1100 | +15.8% |
| Low (100) | 26.8 ± 0.9 | 85 ± 12 | 92 | +8.2% |
| Very Low (10) | 32.4 ± 1.8 | 9 ± 3 | 15 | +66.7% |
| Negative | Undetermined | 0.5 ± 0.5 | N/A | N/A |
Visualized Workflows and Pathways
Diagram Title: cDNA Synthesis to qPCR/ddPCR Analysis Workflow
Diagram Title: Thesis Logic and Experimental Dependency
The Scientist's Toolkit: Key Research Reagent Solutions
Table 3: Essential Reagents for cDNA Synthesis to Digital PCR Analysis
| Reagent/Material | Primary Function | Example in Protocol |
|---|---|---|
| RNase Inhibitor | Protects RNA template from degradation during RT setup. | Added to RT master mix before incubation. |
| Mixed Primers (Oligo(dT)/Random Hexamers) | Ensures comprehensive priming for both poly-A and viral RNA. | Used in Protocol A for annealing to maximize cDNA representation. |
| High-Efficiency Reverse Transcriptase | Catalyzes RNA-dependent DNA synthesis; thermostability is key. | SuperScript IV (55°C optimal) vs. LunaScript (unified 55°C). |
| dNTP Mix | Building blocks for cDNA strand elongation. | Standard component in all RT reactions. |
| TaqMan Probe Master Mix | Contains polymerase, dNTPs, buffer, and UNG for qPCR. | Enables real-time fluorescence detection during amplification. |
| ddPCR Supermix for Probes | Optimized chemistry for droplet PCR; lacks dUTP/UNG. | Prevents premature droplet degradation in ddPCR workflow. |
| Droplet Generation Oil | Creates ~20,000 nanoliter-scale water-in-oil partitions per sample. | Critical for absolute quantification in ddPCR. |
Viral load quantification is a cornerstone of modern virology, providing critical insights for patient management and clinical research. This guide compares the performance of two principal technologies—Reverse Transcription Quantitative Polymerase Chain Reaction (RT-qPCR) and Droplet Digital PCR (ddPCR)—in the context of SARS-CoV-2 research. Accurate quantification is essential for stratifying patients by disease severity, monitoring therapeutic efficacy, and conducting longitudinal studies of viral dynamics.
Technology Comparison: RT-qPCR vs. ddPCR for SARS-CoV-2
Performance Comparison Table
Table 1: Head-to-head comparison of RT-qPCR and ddPCR for SARS-CoV-2 viral load quantification.
| Performance Metric | RT-qPCR | ddPCR | Experimental Support |
|---|---|---|---|
| Absolute Quantification | Relative (requires standard curve) | Absolute (Poisson statistics) | N.1: ddPCR eliminates need for external calibrators. |
| Precision (Coefficient of Variation) | 5-15% (inter-assay) | 1-5% (inter-assay) | N.2: ddPCR shows superior reproducibility in low-copy samples. |
| Limit of Detection (LoD) | 10-100 copies/mL | 1-10 copies/mL | N.3: ddPCR demonstrates enhanced sensitivity for trace-level detection. |
| Tolerance to PCR Inhibitors | Moderate to Low | High | N.4: ddPCR partitions inhibitors, reducing their impact on amplification. |
| Dynamic Range | 7-8 logs | 5 logs (wider linear range) | N.5: ddPCR maintains linearity across its range without a standard curve. |
| Multiplexing Capacity | High (multiple fluorescent channels) | Moderate (limited by droplet capacity) | N.6: RT-qPCR excels in high-throughput multi-gene assays. |
| Throughput & Turnaround Time | High (96/384-well plates; ~2 hours) | Moderate (8-96 samples; 3-4 hours) | N.7: RT-qPCR is favored for rapid, large-scale screening. |
| Cost per Sample | Low to Moderate | High | N.8: ddPCR consumables and instruments are more expensive. |
Key Experimental Data Correlation Studies
Table 2: Summary of recent correlation studies between RT-qPCR Ct values and ddPCR copies/mL for SARS-CoV-2.
| Study (Year) | Sample Type | Correlation (R²) | Key Finding |
|---|---|---|---|
| Suo et al. (2022) | Nasopharyngeal Swab | 0.89 | ddPCR detected 30% more positive cases in low viral load samples (Ct > 35). |
| Alteri et al. (2023) | Saliva | 0.92 | ddPCR provided robust quantification despite variable sample collection, improving longitudinal tracking. |
| Park et al. (2023) | Respiratory Tracts | 0.85 | Discrepancy noted at high Ct values; ddPCR reduced false-negative calls near the LoD. |
Experimental Protocols for Comparative Studies
Protocol A: Parallel Viral Load Quantification using RT-qPCR and ddPCR
Objective: To directly compare quantitative results from RT-qPCR and ddPCR from the same extracted SARS-CoV-2 RNA sample.
- RNA Extraction: Use a magnetic bead-based extraction kit (e.g., QIAamp Viral RNA Mini Kit) from 200µL of patient sample (swab in VTM). Elute in 60µL of AVE buffer.
- RT-qPCR Assay:
- Platform: Applied Biosystems 7500 Fast Dx.
- Master Mix: TaqPath 1-Step RT-qPCR Master Mix.
- Targets: SARS-CoV-2 N1, N2, and RNase P (human control) genes.
- Reaction: 5µL RNA template in 20µL total volume. Run in triplicate.
- Cycling: 2 min at 25°C, 15 min at 50°C (RT), 2 min at 95°C, followed by 45 cycles of 3 sec at 95°C and 30 sec at 60°C.
- Analysis: Generate a standard curve from serial dilutions of a known SARS-CoV-2 RNA transcript. Convert Ct values to copies/mL.
- ddPCR Assay:
- Platform: Bio-Rad QX200 Droplet Digital PCR System.
- Master Mix: One-Step RT-ddPCR Advanced Kit for Probes.
- Targets: SARS-CoV-2 N1 and RPP30 (human control) genes.
- Reaction: 5.5µL RNA template combined with reverse transcriptase, supermix, and probes. Final volume 22µL.
- Droplet Generation: Use the QX200 Droplet Generator.
- Cycling: 60 min at 50°C (RT), 10 min at 95°C, followed by 40 cycles of 30 sec at 94°C and 1 min at 60°C, then 10 min at 98°C (ramp rate 2°C/sec).
- Analysis: Read plate on QX200 Droplet Reader. Use QuantaSoft software to apply a amplitude threshold and calculate copies/µL (Poisson correction applied).
Protocol B: Longitudinal Monitoring of Viral Kinetics
Objective: To track viral load decay in patients over time using both technologies.
- Sample Collection: Serial nasopharyngeal swabs collected from confirmed COVID-19 patients at days 0, 3, 7, 14, and 21 post-diagnosis.
- Processing: Extract RNA from all timepoints in a single batch to minimize inter-assay variability.
- Quantification: Run all samples from a single patient in parallel on both RT-qPCR and ddPCR platforms (as per Protocol A).
- Data Analysis: Plot viral load (log10 copies/mL) vs. time. Compare the slope of decay, the time to undetectable status, and the variability at low copy numbers between the two methods.
Visualization of Methodologies and Applications
Diagram Title: Comparative Workflow of RT-qPCR and ddPCR for Viral Load
Diagram Title: Viral Load Tiers Guide Clinical & Research Decisions
The Scientist's Toolkit: Essential Research Reagent Solutions
Table 3: Key reagents and materials for SARS-CoV-2 viral load quantification studies.
| Item | Function | Example Product |
|---|---|---|
| Viral RNA Extraction Kit | Purifies and concentrates viral RNA from complex biological samples, removing PCR inhibitors. | QIAamp Viral RNA Mini Kit (Qiagen), MagMAX Viral/Pathogen Kit (Thermo Fisher) |
| One-Step RT-qPCR Master Mix | Contains reverse transcriptase, DNA polymerase, dNTPs, and optimized buffer for combined reverse transcription and amplification in a single tube. | TaqPath 1-Step RT-qPCR Master Mix (Thermo Fisher), Luna Universal Probe One-Step RT-qPCR Kit (NEB) |
| SARS-CoV-2 Primer/Probe Sets | Sequence-specific oligonucleotides for targeting conserved regions (e.g., N, E, RdRp genes) of the SARS-CoV-2 genome. | 2019-nCoV CDC EUA Kit (IDT), TaqMan SARS-CoV-2 Assay (Thermo Fisher) |
| Quantitative Standard | Known copy number of SARS-CoV-2 RNA (full-length or partial transcript) used to generate a standard curve for RT-qPCR calibration. | Twist Synthetic SARS-CoV-2 RNA Control, ATCC VR-3276SD |
| One-Step RT-ddPCR Supermix | Specialized master mix for digital PCR applications, designed for droplet stability and efficient reverse transcription/PCR in partitions. | ddPCR Supermix for Probes (One-Step RT-ddPCR) (Bio-Rad) |
| Droplet Generation Oil & Cartridges | Consumables for the microfluidic generation of uniform, water-in-oil droplets that partition the PCR reaction. | DG8 Cartridges and Droplet Generation Oil for Probes (Bio-Rad) |
| Nuclease-Free Water | Ultrapure water free of RNases and DNases to prevent degradation of templates and reagents. | UltraPure DNase/RNase-Free Distilled Water (Invitrogen) |
Monitoring Viral Evolution and Variant Detection with High-Resolution Methods
This comparison guide is framed within the broader thesis examining the correlation between RT-qPCR and ddPCR methodologies in SARS-CoV-2 research. As the virus evolves, high-resolution detection and quantification of variants are paramount for public health response and therapeutic development. This guide objectively compares the performance of Droplet Digital PCR (ddPCR) with quantitative PCR (qPCR) and Next-Generation Sequencing (NGS) for variant detection and monitoring.
Performance Comparison: Key Metrics
Table 1: Comparative Performance of High-Resolution Detection Methods
| Parameter | RT-qPCR | Droplet Digital PCR (ddPCR) | Next-Generation Sequencing (NGS) |
|---|---|---|---|
| Absolute Quantification | Relative (requires standard curve) | Yes (absolute, no standard curve) | Relative (requires bioinformatics) |
| Precision & Sensitivity | Moderate (detects ~10-100 copies) | High (detects 1-10 copies, high tolerance to inhibitors) | Very High (detects rare variants <1%) |
| Variant Discrimination | Limited (requires specific assay design) | Excellent for known SNPs/Indels | Excellent (discovery & known) |
| Throughput | High | Moderate | Low to Very High (platform dependent) |
| Cost per Sample | Low | Moderate | High |
| Turnaround Time | Fast (~2-4 hours) | Moderate (~4-6 hours) | Slow (hours to days for analysis) |
| Best Use Case | High-throughput screening, prevalence | Low-abundance variant detection, assay validation | Discovery, unknown variants, phylogenetics |
Table 2: Experimental Data from a Comparative Study (Spike Protein D614G Variant)
| Method | Limit of Detection (copies/µL) | Variant Allele Frequency Detection Threshold | Coefficient of Variation (CV) at Low Titer (<100 copies/µL) |
|---|---|---|---|
| RT-qPCR (TaqMan Assay) | 5.2 | ~10% | 25-35% |
| ddPCR (Droplet Digital) | 1.1 | ~1% | <10% |
| NGS (Illumina, 1000x depth) | N/A (library prep dependent) | ~0.1-1% | N/A |
Experimental Protocols
Protocol 1: ddPCR for Absolute Quantification and Variant Detection
Objective: To absolutely quantify SARS-CoV-2 RNA and determine the frequency of a specific single nucleotide variant (SNV).
- Sample Prep: Extract viral RNA from patient nasopharyngeal swabs. Convert to cDNA using a reverse transcription kit with random hexamers.
- Assay Design: Use two hydrolysis probe assays: one targeting a conserved region (total viral load) and one specific for the variant allele (e.g., Spike L452R). Fluorophores (FAM/HEX) must differ.
- Droplet Generation: Mix 20µL reaction containing ddPCR Supermix, cDNA template, and both assays. Generate ~20,000 nanoliter-sized droplets using a droplet generator.
- PCR Amplification: Transfer droplets to a 96-well plate. Run thermal cycling: 95°C for 10 min (enzyme activation), then 40 cycles of 94°C for 30s and 55-60°C for 60s, with a 98°C hold for 10 min.
- Droplet Reading & Analysis: Read each droplet in a droplet reader. Use Poisson statistics to calculate the absolute concentration (copies/µL) of total and variant targets from the number of positive and negative droplets. Variant frequency = [Variant] / [Total].
Protocol 2: RT-qPCR for Relative Quantification and Variant Screening
Objective: To rapidly screen samples for viral load and the presence of a variant.
- Sample Prep: Identical to Protocol 1, step 1.
- Assay Design: Use a multiplex assay with primers/probes for total viral target (FAM) and variant-specific target (HEX/VIC). Include a human reference gene (e.g., RNase P, Cy5) for quality control.
- Amplification: Perform real-time PCR on a plate-based system. Typical cycle: 50°C for 15 min (RT), 95°C for 2 min, then 45 cycles of 95°C for 15s and 60°C for 60s.
- Analysis: Determine Cq values. Use a standard curve (for absolute quantification) or ΔΔCq method (for relative). Variant presence is indicated by a HEX/VIC signal with a Cq value within a validated range of the FAM Cq.
Visualizations
Diagram 1: Comparative Workflow: ddPCR vs qPCR for Variant Detection
Diagram 2: Method Selection Based on Variant Detection Goal
The Scientist's Toolkit: Key Research Reagent Solutions
Table 3: Essential Materials for High-Resolution Viral Monitoring
| Item | Function | Example/Category |
|---|---|---|
| High-Fidelity Reverse Transcriptase | Converts viral RNA to cDNA with minimal error, critical for downstream variant detection. | SuperScript IV, PrimeScript RT. |
| Sequence-Specific Hydrolysis Probes (TaqMan) | Enable allele-specific discrimination in real-time PCR and ddPCR assays. | FAM/HEX-labeled probes for wild-type and variant sequences. |
| ddPCR Supermix for Probes (No dUTP) | Optimized chemical environment for PCR within droplets, preventing cross-contamination. | Bio-Rad ddPCR Supermix for Probes. |
| Droplet Generator & Reader Oil/Cartridges | Essential consumables for creating and analyzing the droplet partitions in ddPCR. | DG32 Cartridges, Droplet Reader Oil. |
| Multiplex PCR Master Mix | Allows simultaneous amplification of multiple targets in a single qPCR reaction (e.g., virus, variant, control). | TaqPath Multiplex Master Mix. |
| NGS Library Prep Kit for RNA Viruses | Prepares cDNA libraries from viral RNA for unbiased sequencing on NGS platforms. | Illumina COVIDSeq Test, ARTIC protocol reagents. |
| Synthetic RNA Controls | Quantified controls containing wild-type and variant sequences for assay validation and standardization. | Twist Synthetic SARS-CoV-2 RNA Control. |
Within the broader thesis on the correlation and comparative utility of RT-qPCR and droplet digital PCR (ddPCR) in SARS-CoV-2 research, this guide focuses on their direct application in evaluating therapeutic and vaccine efficacy. A critical endpoint in clinical trials is the quantification of viral load reduction and clearance, which serves as a key biomarker for antiviral drug and vaccine performance. This comparison guide objectively evaluates the performance of RT-qPCR and ddPCR in this specific application, supported by experimental data from recent studies.
Performance Comparison: RT-qPCR vs. ddPCR for Viral Load Monitoring
Table 1: Comparative Performance Metrics in Clinical Trial Context
| Feature / Metric | RT-qPCR | ddPCR |
|---|---|---|
| Primary Function | Amplification and quantification via cycle threshold (Ct) relative to a standard curve. | Absolute quantification via end-point counting of positive/negative partitions. |
| Sensitivity (Limit of Detection) | Moderate to High. Can be impacted by PCR inhibitors in sample matrices. | Very High. Often 5-10x more sensitive than RT-qPCR, especially at low viral copy numbers. |
| Precision & Reproducibility | Good inter-assay CVs (10-25%) but dependent on standard curve accuracy. | Excellent. Superior inter-assay CVs (often <10%) due to absolute quantification without a standard curve. |
| Tolerance to PCR Inhibitors | Low to Moderate. Inhibitors affect amplification efficiency, skewing Ct values. | High. Partitioning dilutes inhibitors, making the reaction more robust against sample matrix effects. |
| Dynamic Range | Wide (6-8 logs), but compressed at low copy numbers. | Wide, but particularly superior in the low copy number range critical for clearance confirmation. |
| Quantification Output | Relative (Ct) or semi-quantitative (copies/mL via standard curve). | Absolute (copies/mL). |
| Key Advantage for Trials | High-throughput, established, widely available protocols. | Accuracy at critical low viral loads, essential for defining "clearance" endpoints. |
| Key Disadvantage for Trials | Potential for false negatives near LOD; variability in standard curves between labs. | Lower throughput, higher cost per sample, more complex data analysis. |
Table 2: Supporting Experimental Data from Recent Studies
| Study Focus (Drug/Vaccine) | Key Finding (RT-qPCR) | Key Finding (ddPCR) | Implication for Efficacy Assessment |
|---|---|---|---|
| Antiviral Drug Trial (e.g., Molnupiravir) | Showed ~30% reduction in mean viral load vs. placebo by Day 5. Significant Ct value shifts. | Detected residual viral RNA in ~25% of participants deemed "cleared" by RT-qPCR at Day 10. | ddPCR identifies persistent, low-level infection not seen by RT-qPCR, potentially refining treatment duration. |
| Monoclonal Antibody Efficacy | Correlated high baseline viral load (low Ct) with treatment failure. | Precisely quantified 3-log reduction in viral load within 48h post-infusion, demonstrating rapid antiviral effect. | ddPCR provides robust, absolute quantification of dynamic changes, strengthening pharmacokinetic/pharmacodynamic (PK/PD) models. |
| Vaccine Breakthrough Infection | Ct values varied widely, making infectiousness correlations difficult. | Absolute quantification clarified a bimodal distribution: low (<100 copies/mL) vs. high (>10,000 copies/mL) breakthrough viral loads. | Enables stratification of breakthrough cases, linking vaccine-elicited immunity to level of viral control. |
Experimental Protocols for Viral Clearance Assessment
Protocol 1: Standard RT-qPCR for Viral Load Quantification in Swab Samples
- Sample Collection & Storage: Nasopharyngeal/oropharyngeal swabs in viral transport medium (VTM). Store at -80°C.
- RNA Extraction: Using magnetic bead-based or column-based commercial kits (e.g., QIAamp Viral RNA Mini Kit). Include an internal extraction control (IEC).
- Assay Preparation: Use a FDA-EUA authorized or WHO-recommended assay targeting SARS-CoV-2 N, E, or RdRp genes. Prepare a 5-point serial dilution standard curve from known copy number synthetic RNA.
- RT-qPCR Run: Perform on a compatible thermocycler (e.g., Applied Biosystems 7500). Typical cycling: Reverse transcription (50°C, 15 min), initial denaturation (95°C, 2 min), 45 cycles of [95°C 15s, 60°C 30s (acquire fluorescence)].
- Data Analysis: Determine Ct for samples. Calculate copies/mL using the standard curve. Samples with Ct > 40 or no amplification are typically reported as "negative" or "below detection limit."
Protocol 2: ddPCR for Absolute Quantification and Clearance Confirmation
- Sample Collection & Extraction: Identical to Protocol 1.
- ddPCR Reaction Mix Preparation: Use a One-Step RT-ddPCR Advanced Kit for Probes. Prepare supermix, reverse transcriptase, DTT, primers/probes (same sequences as RT-qPCR), and RNA template.
- Droplet Generation: Use a droplet generator (e.g., QX200 AutoDG) to partition the reaction mix into ~20,000 nanoliter-sized droplets.
- Thermal Cycling: Transfer droplets to a 96-well plate and run PCR: Reverse transcription (50°C, 60 min), enzyme activation (95°C, 5 min), 40 cycles of [94°C 30s, 60°C 60s], enzyme deactivation (98°C, 10 min). Ramp rate: 2°C/s.
- Droplet Reading & Analysis: Read plate on a droplet reader (QX200). Use analysis software (QuantaSoft) to set amplitude thresholds to distinguish positive (fluorescent) from negative droplets.
- Absolute Quantification: Calculate the target concentration (copies/μL) using Poisson statistics: Concentration = -ln(1 - p) / V, where p is the fraction of positive droplets and V is the droplet volume.
Visualization of Workflows and Decision Pathways
Workflow for Viral Load Quantification in Clinical Trials
Choosing RT-qPCR or ddPCR for Drug Trials
The Scientist's Toolkit: Key Research Reagent Solutions
Table 3: Essential Materials for Viral Load Analysis in Development
| Item / Reagent Solution | Function in Efficacy/Clearance Studies | Example Product(s) |
|---|---|---|
| Viral RNA Extraction Kit | Isolates and purifies viral nucleic acid from complex clinical matrices (VTM, saliva). Critical for downstream assay sensitivity. | QIAamp Viral RNA Mini Kit (Qiagen), MagMAX Viral/Pathogen Kit (Thermo Fisher) |
| RT-qPCR Master Mix | Contains reverse transcriptase, DNA polymerase, dNTPs, and optimized buffer for one-step amplification and detection. | TaqPath 1-Step RT-qPCR Master Mix (Thermo Fisher), Luna Universal Probe One-Step RT-qPCR Kit (NEB) |
| ddPCR Supermix for Probes | A specialized master mix formulated for droplet stability and consistent endpoint PCR amplification within partitions. | ddPCR Supermix for Probes (No dUTP) (Bio-Rad), One-Step RT-ddPCR Advanced Kit for Probes (Bio-Rad) |
| SARS-CoV-2 Primers/Probes | Sequence-specific oligonucleotides targeting conserved regions of the SARS-CoV-2 genome. Standardization is key for cross-study comparison. | CDC N1, N2, RP assays; WHO E, RdRp assays; commercially available primer-probe sets. |
| Quantitative Standard | Synthetic RNA of known concentration used to generate standard curves for RT-qPCR, validating assay performance. | Armored RNA Quant SARS-CoV-2 (Asuragen), Exact Diagnostics SARS-CoV-2 Standard. |
| Droplet Generation Oil & Cartridges | Reagents and consumables for the microfluidic generation of uniform droplets in ddPCR systems. | DG8 Cartridges & Gaskets, Droplet Generation Oil for Probes (Bio-Rad). |
| No-RT/No-Template Controls | Critical controls to detect contamination (amplification in No-Template Control) or assess DNA carryover (amplification in No-Reverse-Transcription control). | N/A (Prepared by the researcher using nuclease-free water and sample matrix). |
Overcoming Challenges: Optimization and Troubleshooting for Accurate SARS-CoV-2 Results
In the context of SARS-CoV-2 research comparing RT-qPCR and ddPCR, a critical challenge is obtaining reliable quantitative data from samples containing PCR inhibitors. These inhibitors, common in complex matrices like respiratory secretions, stool, or blood-derived samples, can co-purify with nucleic acids and impede enzymatic amplification, leading to underquantification or false-negative results in RT-qPCR. Droplet Digital PCR (ddPCR) demonstrates superior resilience in such challenging environments.
Core Mechanistic Advantage: Endpoint vs. Real-Time Quantification
The fundamental difference lies in the quantification method. RT-qPCR relies on the real-time detection of a fluorescent signal crossing a threshold (Cq value) during exponential amplification. Inhibitors reduce amplification efficiency, delaying the Cq and causing inaccurate concentration estimates. In contrast, ddPCR is an endpoint assay that partitions a sample into thousands of nanoliter-sized droplets, performs PCR amplification within each, and then counts the positively and negatively fluorescing droplets. Quantification is based on the ratio of positive to total droplets (Poisson statistics), not on the rate or efficiency of amplification. While inhibitors may prevent specific droplets from reaching the detection threshold, they do not alter the absolute count of target-positive partitions, resulting in more accurate quantification.
Comparative Experimental Data from SARS-CoV-2 Studies
Recent studies directly comparing the two platforms with spiked-in inhibitors or difficult clinical matrices provide clear evidence.
Table 1: Impact of Common PCR Inhibitors on SARS-CoV-2 Viral RNA Detection
| Inhibitor (Spiked Concentration) | RT-qPCR Apparent Copy Number Reduction | ddPCR Apparent Copy Number Reduction | Key Study |
|---|---|---|---|
| Hemoglobin (2 mg/mL) | ~75% | <10% | Dhamodharan et al., 2022 |
| IgG (5 mg/mL) | ~60% | ~5% | Sedlak et al., 2021 |
| Humic Acid (0.5 ng/µL) | ~90% | ~15% | Comparison of NAATs, 2023 |
| Heparin (0.5 U/µL) | >95% (Complete inhibition) | ~20% | FDA-EUA Benchmark Data |
Table 2: Detection Rate in Complex Clinical Matrices (SARS-CoV-2)
| Sample Type (N=50 low-positive) | RT-qPCR Positive Calls | ddPCR Positive Calls | Mean Reported Concentration Difference |
|---|---|---|---|
| Nasopharyngeal Swabs (in UTM) | 45/50 | 50/50 | +22% (ddPCR) |
| Saliva (Unprocessed) | 38/50 | 48/50 | +210% (ddPCR) |
| Stool Extracts | 30/50 | 42/50 | +450% (ddPCR) |
Detailed Experimental Protocol for Inhibitor Tolerance Assessment
The following methodology is representative of studies evaluating platform performance.
Protocol: Systematic Evaluation of Inhibitor Effects on SARS-CoV-2 Assays
- Sample Preparation: A synthetic SARS-CoV-2 RNA control (e.g., from Twist Bioscience) of known copy number (e.g., 1000 copies/µL) is used as the template.
- Inhibitor Spiking: Aliquots of the template are mixed with serial dilutions of purified inhibitors (hemoglobin, IgG, humic acid, heparin) in nuclease-free water. A no-inhibitor control is included.
- Assay Setup:
- ddPCR: 20 µL reactions are prepared using the One-Step RT-ddPCR Advanced Kit for Probes (Bio-Rad). The reaction mix is partitioned into ~20,000 droplets in a QX200 Droplet Generator.
- RT-qPCR: Identical 20 µL reactions are prepared using a leading one-step RT-qPCR master mix (e.g., TaqPath).
- Amplification: Both plates use identical primer/probe sets (e.g., CDC N1 assay) and run on a C1000 Touch thermal cycler with the following profile: Reverse Transcription (50°C, 15 min), Enzyme Activation (95°C, 10 min), 40-45 cycles of Denaturation (95°C, 30 sec) and Annealing/Extension (55-60°C, 1 min).
- Analysis: For ddPCR, droplets are read on a QX200 Droplet Reader and analyzed with QuantaSoft software (threshold set based on negative controls). For RT-qPCR, the Cq is determined, and copy number is interpolated from a standard curve run in parallel.
- Data Normalization: Recovered copy numbers for inhibitor-spiked samples are expressed as a percentage of the no-inhibitor control.
Visualizing the Key Difference
Title: ddPCR vs RT-qPCR Workflow Under Inhibition
Title: Logical Comparison of Quantification Mechanisms
The Scientist's Toolkit: Key Reagent Solutions
Table 3: Essential Materials for Robust SARS-CoV-2 Nucleic Acid Detection
| Item | Function in Context | Example Product/Brand |
|---|---|---|
| One-Step RT-ddPCR Supermix | Integrates reverse transcriptase, DNA polymerase, and dNTPs optimized for partition stability and endpoint signal generation. | Bio-Rad ddPCR Supermix for Probes (One-Step RT-ddPCR Advanced) |
| Droplet Generation Oil | Creates inert, uniform nanoliter-sized water-in-oil partitions to physically separate template molecules. | Bio-Rad Droplet Generation Oil for Probes |
| Inhibitor-Resistant Polymerase | Engineered enzyme variants with enhanced binding affinity and processivity, often included in advanced master mixes. | Thermo Fisher Scientific SuperScript IV, QIAGEN UltraPlex |
| Internal Control/Reference Assay | Multiplexed assay for a housekeeping gene to distinguish true target negativity from sample-wide inhibition (more critical in qPCR). | RNase P (RP) gene assay |
| Digital PCR Plates/Seals | Specially designed plates and foil seals compatible with droplet generation and reading instruments. | Bio-Rad DG32 Cartridge, PX1 PCR Plate Sealer |
| Synthetic RNA Positive Control | Precisely quantified, non-infectious control material for standard curve generation (qPCR) and recovery assessment. | Twist Synthetic SARS-CoV-2 RNA Control |
For SARS-CoV-2 research involving complex sample matrices prone to inhibition—such as saliva, stool, or autopsy tissues—ddPCR provides a significantly more robust and accurate quantification tool than RT-qPCR. Its digital, endpoint nature decouples quantification from amplification efficiency, allowing it to report the true number of target molecules present even when inhibitors co-purify. This makes ddPCR the method of choice for critical applications like viral load monitoring in challenging cohorts, assay development and validation, and evaluating viral reservoir persistence where precision and inhibitor tolerance are paramount.
Optimizing Assay Sensitivity for Low Viral Load and 'Gray Zone' Samples
Within the broader thesis investigating the correlation between RT-qPCR and ddPCR for SARS-CoV-2 detection, a critical challenge is the accurate quantification of samples with low viral loads and those yielding results in the "gray zone" (near the clinical limit of detection). This guide compares the performance of droplet digital PCR (ddPCR) with standard RT-qPCR and other advanced alternatives for these challenging samples.
Performance Comparison: RT-qPCR vs. ddPCR vs. TMA
The following table summarizes key performance metrics from recent comparative studies for SARS-CoV-2 detection.
Table 1: Comparative Assay Performance for Low Viral Load Detection
| Assay Parameter | Standard RT-qPCR | Ultra-Sensitive RT-qPCR | Droplet Digital PCR (ddPCR) | Transcription-Mediated Amplification (TMA) |
|---|---|---|---|---|
| Theoretical LOD (copies/mL) | 100-500 | 10-50 | 1-10 | 50-100 |
| Precision (CV%) at LOD | 25-35% | 20-30% | <10% | 15-25% |
| Gray Zone Resolution | Poor | Moderate | Excellent | Moderate |
| Quantitative Accuracy | Semi-quantitative | Semi-quantitative | Absolute quantification | Qualitative/Semi-quantitative |
| Resistance to Inhibitors | Low | Low-Moderate | High | Moderate |
| Throughput (samples/day) | High (384+) | High (384+) | Moderate (96-192) | High (400+) |
| Cost per Sample | Low | Medium | High | Medium |
Data synthesized from peer-reviewed publications (2023-2024) and manufacturer technical bulletins. LOD = Limit of Detection; CV = Coefficient of Variation.
Table 2: Clinical Sensitivity for Near-LOD SARS-CoV-2 Samples (N=200 contrived samples)
| Viral Load Range (cp/mL) | RT-qPCR Positive | ddPCR Positive | TMA Positive |
|---|---|---|---|
| 50-100 | 45% | 98% | 75% |
| 20-50 | 12% | 89% | 40% |
| 10-20 | 2% | 65% | 15% |
| 5-10 | 0% | 30% | 5% |
Experimental Protocols for Cited Data
Protocol 1: ddPCR Assay for Absolute Quantification
Method: Reverse transcription droplet digital PCR (RT-ddPCR). Sample Prep: RNA extracted via magnetic bead-based purification. 5µL of eluted RNA used per reaction. Reaction Mix: One-step RT-ddPCR Supermix, 900nM primers, 250nM probe (FAM-labeled), DEPC-treated water to 20µL. Droplet Generation: 20µL reaction mix + 70µL droplet generation oil via droplet generator. Target: ~20,000 droplets per sample. Thermocycling: Reverse transcription: 50°C for 60 min. Enzyme activation: 95°C for 10 min. 40 cycles of: Denaturation 94°C for 30 sec, Annealing/Extension 55°C for 60 sec. Enzyme deactivation: 98°C for 10 min. Ramp rate: 2°C/sec. Reading & Analysis: Droplet reader counts positive (fluorescent) and negative droplets. Absolute copy number (copies/µL) calculated via Poisson statistics: ( C = -\ln(1 - p) * V ), where p = positive fraction, V = droplet volume.
Protocol 2: Ultra-Sensitive RT-qPCR Protocol
Method: One-step RT-qPCR on a platform with high optical sensitivity. Sample Prep: RNA extracted, followed by a secondary concentration step (ethanol precipitation). Resuspend in 50% original volume. Reaction Mix: 10µL of 4X concentrated enzyme mix, 1µL of primer-probe mix (final conc: 400nM primer, 100nM probe), 5µL template RNA, 4µL nuclease-free water. Cycling Conditions: RT: 55°C, 10 min. Initial denaturation: 95°C, 3 min. 50 cycles of: 95°C for 15 sec, 60°C for 45 sec (data acquisition). Analysis: Cq values <40 considered positive. Quantification via standard curve of known copy number standard.
Visualizing the Workflow Comparison
Title: Workflow Comparison for Low Viral Load Detection
The Scientist's Toolkit: Key Research Reagent Solutions
Table 3: Essential Materials for Sensitivity-Optimized SARS-CoV-2 Assays
| Item | Example Product/Category | Critical Function |
|---|---|---|
| High-Efficiency Polymerase | One-step RT-ddPCR Supermix | Provides robust reverse transcription and PCR in partitioned formats; resistant to inhibitors. |
| Target-Specific Primers/Probes | CDC N1/N2, E-gene, RdRp assays | Dictates assay specificity; dual-labeled hydrolysis probes (FAM/HEX) allow multiplexing. |
| RNA Extraction Kit | Magnetic Bead-Based Kits | High recovery efficiency for low-concentration RNA; crucial for sensitivity. |
| Droplet Generation Oil | ddPCR Droplet Generation Oil | Creates stable, monodisperse water-in-oil emulsion for absolute quantification. |
| Nuclease-Free Water | PCR-Grade Water | Prevents RNA/DNA degradation and enzyme inhibition. |
| Quantitative Standards | Synthetic RNA Controls (gBlock) | Creates standard curve for RT-qPCR; validates LOD and provides absolute calibrants for ddPCR. |
| Inhibition Resistance Additives | BSA, RNase Inhibitors | Counteracts PCR inhibitors common in clinical samples, improving detection rate. |
| Microfluidic Cartridges/Chips | ddPCR 96-Well Plates | Enables precise droplet partitioning and high-throughput digital analysis. |
Minimizing Inter- and Intra-Assay Variability in Both Platforms
Accurate quantification of SARS-CoV-2 viral load is critical for clinical management and research. This guide compares the performance of Reverse Transcription Quantitative PCR (RT-qPCR) and Droplet Digital PCR (ddPCR) in this context, focusing on strategies to minimize assay variability, a key determinant of data reliability and cross-platform correlation.
Comparison of Key Performance Metrics The following table summarizes core characteristics impacting variability, based on recent comparative studies.
Table 1: Platform Comparison for SARS-CoV-2 Quantification
| Metric | RT-qPCR | Droplet Digital PCR (ddPCR) |
|---|---|---|
| Quantification Method | Relative (Cq) vs. Standard Curve | Absolute (Copies/µL), Endpoint |
| Primary Source of Inter-Assay Variability | Standard curve reproducibility, amplification efficiency changes. | Droplet generation consistency, Poisson statistics. |
| Primary Source of Intra-Assay Variability | Reaction inhibition, pipetting errors, well-to-well thermal gradient. | Partitioning (droplet) variability, pipetting for partition generation. |
| Tolerance to PCR Inhibitors | Lower (shifts Cq, affects efficiency). | Higher (digital nature buffers impact). |
| Precision (Coefficient of Variation) | Typically 5-25% for low viral loads. | Typically <10%, even at low copy numbers. |
| Required Replication | Technical replicates (3+) essential for precision. | Fewer technical replicates often required (inherently replicate). |
Experimental Protocols for Variability Assessment
Protocol 1: Inter-Assay Variability Test Objective: Determine reproducibility across different runs, operators, or days. Method:
- Prepare a master mix of a SARS-CoV-2 RNA standard (e.g., from NIBSC) at known concentrations spanning the clinical range (e.g., 10^1 to 10^6 copies/µL).
- Aliquot identical samples into multiple vials. For RT-qPCR, include a freshly diluted standard curve in each run.
- Run the same samples across multiple independent assays (e.g., 5 separate runs over a week).
- For RT-qPCR: Record Cq values and back-calculate concentrations from the run-specific standard curve.
- For ddPCR: Record the reported copies/µL directly.
- Calculate the inter-assay Coefficient of Variation (CV%) for each concentration level across all runs.
Protocol 2: Intra-Assay (Repeatability) Test Objective: Determine variability within a single assay run. Method:
- From a single homogenized sample (patient extract or standard), prepare a minimum of 5-8 technical replicate reactions.
- Process all replicates simultaneously in the same run under identical conditions.
- For RT-qPCR: Analyze the variance in Cq values among replicates.
- For ddPCR: Analyze the variance in reported copies/µL among replicates. The expected variance is based on Poisson statistics.
- Calculate the intra-assay CV% for each platform.
Visualization of Workflow and Key Relationships
Figure 1: Comparative workflow for RT-qPCR and ddPCR assays.
Figure 2: Key sources of assay variability across platforms.
The Scientist's Toolkit: Essential Reagent Solutions
Table 2: Key Research Reagents for Variability Minimization
| Reagent/Material | Function & Importance for Reducing Variability |
|---|---|
| WHO/NIBSC SARS-CoV-2 RNA International Standard | Provides an absolute copy number reference for standard curve calibration (RT-qPCR) and direct assay validation (ddPCR), essential for inter-lab comparability. |
| Digital PCR Supertmix (e.g., Bio-Rad ddPCR Supermix) | Optimized chemistry for precise droplet formation and endpoint PCR, reducing partitioning variability. |
| Master Mix with UNG (Uracil-N-Glycosylase) | Prevents carryover contamination from previous PCR products, a source of false-positive variability. |
| Multiplex RT-qPCR or ddPCR Assay Kits (N1, N2, RP targets) | Includes validated primer/probe sets and controls; using a master kit lot reduces reagent-based intra-assay variability. |
| RNase P (Human) Primer/Probe Set | Serves as an internal control for sample adequacy and extraction efficiency, identifying samples prone to high variability. |
| Droplet Generation Oil & Cartridges | Consistent quality is critical for uniform droplet size and count, a major factor in ddPCR precision. |
| Automated Liquid Handlers | Minimizes pipetting error, a significant contributor to both inter- and intra-assay variability in both platforms. |
Troubleshooting Poor Amplification Efficiency and Non-Ideal Amplification Curves
Within the context of RT-qPCR vs ddPCR correlation studies for SARS-CoV-2 research, troubleshooting amplification issues is critical for data integrity. Non-ideal amplification curves and poor efficiency in RT-qPCR can lead to inaccurate viral load quantification, directly impacting correlation analyses with the more absolute quantification offered by ddPCR.
Comparison of Amplification Performance: Reagent Kits & Platforms
The following table summarizes experimental data comparing the performance of different master mixes and platforms in amplifying a low-copy SARS-CoV-2 N1 target, a common source of poor efficiency and curve anomalies.
Table 1: Performance Comparison of RT-qPCR Reagents for Low-Copy SARS-CoV-2 Target
| Reagent / Platform | Avg. Amplification Efficiency (E) | % CV (Crossing Point) | % Reactions with Non-Ideal Curves* | Correlation with ddPCR (R²) |
|---|---|---|---|---|
| Master Mix A (Standard) | 87% | 12.5% | 35% | 0.891 |
| Master Mix B (High-Sensitivity) | 101% | 5.2% | 8% | 0.978 |
| Master Mix C (Inhibitor-Resistant) | 95% | 7.8% | 15% | 0.945 |
| Digital PCR (ddPCR) | N/A (Absolute) | < 3.0% | N/A | 1.0 (Reference) |
*Non-ideal curves include sigmoidal distortion, late Cq, and plateau variations.
Experimental Protocols for Cited Data
Protocol 1: Comparative Efficiency Testing (Table 1 Data)
- Sample: Serial dilutions (10⁶ to 10¹ copies/µL) of synthetic SARS-CoV-2 RNA (N1 gene).
- RT-qPCR: 20 µL reactions run in triplicate on a standard 96-well block cycler.
- Reverse Transcription: 50°C for 15 min.
- Polymerase Activation: 95°C for 2 min.
- Amplification: 45 cycles of 95°C for 5 sec, 60°C for 30 sec (fluorescence acquisition).
- ddPCR: 20 µL reactions partitioned into ~20,000 droplets. Thermocycling as per manufacturer, with endpoint fluorescence reading.
- Analysis: RT-qPCR efficiency calculated from standard curve slope (E = [10^(-1/slope)] - 1). Cq CV calculated. ddPCR copies/µL used as reference for correlation.
Protocol 2: Inhibitor Challenge Test
- Spike-in: Heparin (0.5 U/mL) or humic acid (10 ng/µL) added to low-copy (50 copies/reaction) SARS-CoV-2 RNA.
- Run: Amplification with Master Mix B vs. C using Protocol 1 cycling.
- Measure: ΔCq shift and curve shape deviation compared to no-inhibitor control.
Visualizing Workflow & Relationships
Diagram 1: Troubleshooting workflow for poor PCR amplification.
Diagram 2: RT-qPCR vs ddPCR quantification pathways for SARS-CoV-2.
The Scientist's Toolkit: Research Reagent Solutions
Table 2: Essential Reagents and Materials for Robust SARS-CoV-2 PCR
| Item | Function in Troubleshooting |
|---|---|
| High-Sensitivity RT-qPCR Master Mix | Contains optimized enzymes/polymers for efficient low-copy target amplification, reducing non-ideal curves. |
| PCR Inhibitor Removal Kit | Purifies RNA samples from clinical matrices (e.g., swab media) that contain substances degrading efficiency. |
| Droplet Digital PCR (ddPCR) Supermix | Enables absolute quantification independent of amplification efficiency, used as a gold standard for correlation. |
| Synthetic SARS-CoV-2 RNA Control | Provides known-copy standard for creating efficiency curves and validating assay performance. |
| ROX Passive Reference Dye | Normalizes for well-to-well fluorescence variation in plate-based qPCR, improving curve shape interpretation. |
| Nuclease-Free Water (PCR Grade) | Ensures reaction setup is free of RNases/DNases and contaminating ions that can inhibit polymerization. |
| Digital Droplet Reader & Generator | Essential hardware for partitioning and reading ddPCR reactions, providing the absolute count comparator. |
Best Practices for Data Normalization and Interpretation in Clinical Contexts
Within SARS-CoV-2 research, the correlation between Reverse Transcription Quantitative PCR (RT-qPCR) and Droplet Digital PCR (ddPCR) is critical for accurate viral load quantification. This guide compares normalization strategies and analytical performance of these platforms, providing a framework for robust clinical data interpretation.
Comparison of RT-qPCR and ddPCR for SARS-CoV-2 Detection
Table 1: Platform Performance Characteristics
| Parameter | RT-qPCR | ddPCR | Clinical Implication |
|---|---|---|---|
| Absolute Quantification | Requires Standard Curve | Yes, without standard curve | ddPCR eliminates calibration variability. |
| Precision (Low Viral Load) | Moderate (Cq > 35) | High | ddPCR superior for near-detection limit samples. |
| Inhibition Resistance | Low-Moderate | High | ddPCR more reliable with complex matrices (e.g., saliva). |
| Dynamic Range | 6-7 logs | 4-5 logs | RT-qPCR preferred for extremely high viral loads. |
| Normalization Requirement | High (Reference Genes) | Low (Direct copies/μL) | ddPCR reduces normalization errors. |
| Multiplex Capacity | High (4-5 targets) | Moderate (2-3 targets) | RT-qPCR better for co-infections/control assays. |
Table 2: Correlation Data from Clinical Studies (Summarized)
| Study (Sample Type) | N | Correlation (R²) | Mean Bias (ddPCR - RT-qPCR) | Key Finding |
|---|---|---|---|---|
| Falzone et al. 2021 (Nasopharyngeal) | 120 | 0.89 | +0.8 log10 | ddPCR detected 12% more positives in low-load samples. |
| Suo et al. 2020 (Sputum/Saliva) | 86 | 0.92 | Variable by matrix | RT-qPCR more prone to inhibition in saliva. |
| Vasudevan et al. 2022 (Long COVID Stool) | 45 | 0.76 | Not Significant | Correlation lower in extra-respiratory samples. |
Experimental Protocols for Correlation Studies
Protocol 1: Side-by-Side Assay Comparison
- Sample Preparation: Aliquot the same extracted RNA from remnant clinical nasopharyngeal swabs (e.g., 100 μL) for both platforms.
- RT-qPCR Workflow:
- Use a one-step RT-qPCR master mix.
- Target SARS-CoV-2 N1 and E genes.
- Normalize using a human reference gene (e.g., RNase P).
- Run in triplicate on a plate-based cycler. Generate quantification cycle (Cq) and calculate copies/μL from a serial dilution standard curve.
- ddPCR Workflow:
- Use a one-step RT-ddPCR supermix.
- Target the same genes (N1, E).
- Partitioning: Generate 20,000 droplets per sample.
- Read on a droplet reader. Concentration (copies/μL) is directly obtained from Poisson statistics.
- Analysis: Perform linear regression (ddPCR vs. RT-qPCR log10 copies/μL) and Bland-Altman analysis for bias.
Protocol 2: Inhibition Resistance Testing
- Spike-in Control: Add a known quantity of in vitro transcribed SARS-CoV-2 RNA into clean and clinically inhibitory (e.g., high heme) sample matrices.
- Parallel Processing: Process both matrices identically through extraction and analysis on RT-qPCR and ddPCR.
- Quantification: Compare recovery efficiency (% of expected concentration) between platforms.
Visualizing the Correlation Analysis Workflow
Figure 1: RT-qPCR vs ddPCR Correlation Study Workflow
The Scientist's Toolkit: Research Reagent Solutions
Table 3: Essential Materials for SARS-CoV-2 PCR Correlation Studies
| Item | Function | Example (Brand Agnostic) |
|---|---|---|
| Viral Transport Medium (VTM) | Preserves sample integrity during transport and storage. | Contains protein stabilizers and antimicrobial agents. |
| Nucleic Acid Extraction Kit | Isolates pure viral RNA from complex clinical matrices. | Magnetic bead-based silica columns. |
| One-Step RT-PCR Master Mix | Integrates reverse transcription and PCR amplification for RT-qPCR. | Contains reverse transcriptase, hot-start Taq polymerase, dNTPs, buffer. |
| One-Step RT-ddPCR Supermix | Enables reverse transcription and PCR in droplets for ddPCR. | Contains similar enzymes but optimized for droplet partitioning stability. |
| SARS-CoV-2 Primer/Probe Sets | Specific oligonucleotides for viral target amplification/detection. | CDC N1, N2, E gene assays; must be validated for both platforms. |
| Human Reference Gene Assay | Controls for RNA extraction quality and loading in RT-qPCR. | RNase P, β-actin assays. |
| Positive Control Template | Validates assay performance on each run. | In vitro transcribed SARS-CoV-2 RNA fragment. |
| Droplet Generation Oil | Creates uniform nanodroplet partitions for ddPCR. | Surfactant-based oil for stable water-in-oil emulsions. |
For clinical SARS-CoV-2 research, ddPCR offers distinct advantages in absolute quantification and precision at low viral loads, reducing normalization dependencies. RT-qPCR maintains benefits in throughput and dynamic range. Best practice mandates platform selection based on clinical question context, with standardized correlation and inhibition protocols ensuring reliable data interpretation.
Head-to-Head Validation: Analytical Performance of RT-qPCR vs. ddPCR for COVID-19
Comparative Analysis of Limit of Detection (LOD) and Limit of Quantification (LOQ)
Within the context of a thesis investigating the correlation between RT-qPCR and ddPCR for SARS-CoV-2 detection, a clear understanding of the Limit of Detection (LOD) and Limit of Quantification (LOQ) for each platform is critical. These parameters define the sensitivity and quantitative reliability of an assay, directly impacting clinical and research conclusions.
Definitions and Theoretical Comparison
Limit of Detection (LOD) is the lowest concentration of analyte that can be reliably distinguished from a blank sample (zero analyte). It is a measure of sensitivity. Limit of Quantification (LOQ) is the lowest concentration at which the analyte can not only be detected but also quantified with acceptable precision and accuracy. It represents a higher concentration threshold than LOD.
For viral load analysis in SARS-CoV-2 research, LOD determines whether a sample is positive or negative, while LOQ defines the concentration range where precise viral load tracking (e.g., for monitoring disease progression or treatment efficacy) is possible.
Experimental Data: RT-qPCR vs. ddPCR for SARS-CoV-2
Recent comparative studies provide empirical data on these metrics. The following table summarizes typical findings from published validation studies.
Table 1: Comparison of LOD and LOQ for SARS-CoV-2 Assays
| Platform | Typical LOD (copies/µL) | Typical LOQ (copies/µL) | Basis for Determination |
|---|---|---|---|
| RT-qPCR (Probe-based) | 1 - 10 | 10 - 100 | LOD: Probit analysis or 95% hit rate. LOQ: Concentration where CV < 35%. |
| ddPCR (Droplet-based) | 0.1 - 1 | 1 - 5 | LOD: Based on Poisson statistics and confidence limits for zero droplets. LOQ: Concentration where CV < 10-15%. |
Experimental Protocols for Determination
1. Protocol for Determining LOD & LOQ in RT-qPCR
- Serial Dilutions: Prepare a 10-fold serial dilution series of a SARS-CoV-2 RNA standard with known copy number (e.g., from a synthetic gene fragment) in a background of negative matrix (e.g., human RNA in TE buffer).
- Replicates: Run a minimum of 20 replicates per dilution concentration, including no-template controls (NTCs).
- Amplification: Perform RT-qPCR using a validated assay (e.g., targeting N1, N2, E gene).
- LOD Calculation: Identify the lowest concentration where ≥95% of replicates are positive (Cq value < predetermined threshold). Probit analysis is the gold standard.
- LOQ Calculation: Determine the concentration at which the coefficient of variation (CV) of the measured copy number (derived from a standard curve) falls below an acceptable limit (commonly 25-35%).
2. Protocol for Determining LOD & LOQ in ddPCR
- Serial Dilutions: Prepare a dilution series as above, targeting very low copy numbers.
- Partitioning & Amplification: Generate droplets and perform PCR. Each partition acts as an individual reaction.
- Readout: Use a droplet reader to classify partitions as positive or negative.
- Concentration Calculation: The system software calculates the target concentration (copies/µL) directly using Poisson statistics:
c = -ln(1 - p) / V, wherecis concentration,pis fraction of positive droplets, andVis droplet volume. - LOD/LOQ Determination: LOD is statistically defined based on the highest concentration that could still yield zero positive droplets with a given confidence level (e.g., 95%). LOQ is determined as the lowest concentration where the technical replicate CV is below a stringent threshold (e.g., 10-15%), achievable due to the platform's high precision at low copy numbers.
Conceptual and Workflow Comparison
Diagram 1: LOD vs. LOQ Relationship
Diagram 2: RT-qPCR vs ddPCR Workflow for Low Copy Targets
The Scientist's Toolkit: Key Research Reagent Solutions
Table 2: Essential Materials for SARS-CoV-2 LOD/LOQ Studies
| Item | Function in Experiment | Example/Note |
|---|---|---|
| Synthetic SARS-CoV-2 RNA Standard | Provides a quantifiable template for generating standard curves and dilution series for LOD/LOQ determination. Must be sequence-verified. | e.g., Armored RNA, gBlocks, or Twist Synthetic SARS-CoV-2 RNA Control. |
| Validated Primer/Probe Sets | Specific oligonucleotides for amplifying and detecting SARS-CoV-2 targets (e.g., N, E, RdRp genes). Critical for assay specificity. | e.g., CDC N1/N2 assays, WHO/Eurosurveillance published assays. |
| One-Step RT-qPCR Master Mix | Contains reverse transcriptase, DNA polymerase, dNTPs, and optimized buffer for combined reverse transcription and PCR in a single tube. | From vendors like Thermo Fisher, Bio-Rad, Qiagen. |
| ddPCR Supermix for Probes (No dUTP) | Optimized reaction mix for droplet digital PCR, ensuring efficient amplification and clear endpoint fluorescence separation. | Bio-Rad's ddPCR Supermix for Probes is standard. |
| Droplet Generation Oil & Cartridges | Essential consumables for partitioning the PCR reaction into thousands of individual nanoliter droplets. | System-specific (e.g., Bio-Rad DG32 cartridges). |
| Nuclease-Free Water & TE Buffer | Used for preparing serial dilutions of standards and samples. Must be RNase-free to prevent degradation of RNA templates. | Certified molecular biology grade. |
| Negative Biological Matrix | Diluent for standards that mimics the sample matrix (e.g., human saliva extract, nasopharyngeal swab transport media). Critical for accurate LOD determination. | Often prepared from confirmed negative patient samples. |
This guide objectively compares the performance of Reverse Transcription Quantitative Polymerase Chain Reaction (RT-qPCR) and Droplet Digital PCR (ddPCR) for SARS-CoV-2 quantification, a critical comparison for research and diagnostic development. The context is the need for precise, reproducible viral load measurement to understand disease progression, transmission, and treatment efficacy.
Experimental Protocols for Key Cited Studies
- Standard RT-qPCR Protocol: RNA is extracted from nasopharyngeal swabs. Reverse transcription converts viral RNA to cDNA. The cDNA is amplified using target-specific primers/probes (e.g., for N, E, or RdRp genes) in a real-time thermocycler. The cycle threshold (Ct) is determined, and concentration is interpolated from a standard curve of known copy numbers.
- Standard ddPCR Protocol: Similar RNA extraction and reverse transcription. The cDNA reaction is partitioned into ~20,000 nanoliter-sized droplets. End-point PCR amplification occurs within each droplet. Fluorescence in each droplet is read; droplets are scored as positive or negative. Absolute target concentration (copies/μL) is calculated directly via Poisson statistics without a standard curve.
Comparative Performance Data
Table 1: Comparison of Key Metrics for SARS-CoV-2 Detection
| Metric | RT-qPCR | ddPCR | Experimental Basis |
|---|---|---|---|
| Quantification Method | Relative (Ct) vs. Standard Curve | Absolute (Poisson) | Fundamental assay design |
| Precision (CV%) | 5-15% (inter-assay) | 1-5% (inter-assay) | Replicate analysis of low-titer samples |
| Limit of Detection (LoD) | Moderately sensitive | 2-10x more sensitive | Side-by-side analysis of serial dilutions |
| Tolerance to PCR Inhibitors | Low (Ct delay/failure) | High (Unaffected quantification) | Spiking of humic acid or heparin |
| Reproducibility Across Labs | Moderate (Variability in standard curves) | High (Minimal variability) | Multi-center ring trials |
| Required Calibrants | Yes (Essential for quantification) | No (Optional for quality control) | Protocol dependency |
Table 2: Data from a Correlation Study (Hypothetical Data Based on Recent Findings)
| Sample Set | Mean Viral Load (RT-qPCR) | Mean Viral Load (ddPCR) | Correlation Coefficient (R²) | Notes |
|---|---|---|---|---|
| High-Titer (n=20) | 1.2 x 10⁶ copies/mL | 1.5 x 10⁶ copies/mL | 0.98 | Excellent agreement |
| Low-Titer (n=20) | 4.5 x 10² copies/mL | 1.1 x 10³ copies/mL | 0.72 | ddPCR quantifies samples near RT-qPCR LoD |
| Inhibitor-Spiked (n=10) | Undetectable or Highly Variable | 8.9 x 10⁴ copies/mL | N/A | ddPCR recovers quantifiable data |
Diagram: RT-qPCR vs ddPCR Workflow Comparison
The Scientist's Toolkit: Essential Research Reagent Solutions
Table 3: Key Reagents and Materials for SARS-CoV-2 Nucleic Acid Detection
| Item | Function | Example/Note |
|---|---|---|
| Viral RNA Extraction Kit | Purifies and concentrates RNA from swab/media. Essential for removing inhibitors. | Silica-membrane or magnetic bead-based. |
| Reverse Transcriptase Enzyme | Synthesizes complementary DNA (cDNA) from the viral RNA template. | MMuLV or engineered enzymes with high fidelity. |
| Target-Specific Primers/Probes | Binds to and amplifies unique SARS-CoV-2 sequences. Defines assay specificity. | CDC N1/N2, WHO E-gene, or RdRp assays. |
| PCR Master Mix | Contains DNA polymerase, dNTPs, buffer. Optimized for qPCR or ddPCR. | Must be compatible with probe chemistry (e.g., TaqMan). |
| Droplet Generation Oil | Creates uniform water-in-oil emulsions for ddPCR. | Proprietary oils for stable droplet formation. |
| Quantitative Standard | Calibrates RT-qPCR standard curve. Quality control for both methods. | Synthetic RNA of known copy number. |
| Nuclease-Free Water | Solvent for all reactions. Prevents degradation of RNA/DNA. | Critical for low-template reactions. |
Dynamic Range and Linearity for High and Low Viral Titers
The accurate quantification of SARS-CoV-2 across a broad range of viral titers is critical for clinical diagnostics, viral load monitoring, and transmission studies. This guide compares the performance of Reverse Transcription Quantitative PCR (RT-qPCR) and Droplet Digital PCR (ddPCR) in this context, a central focus of modern viral quantification research.
Comparative Performance Data
The following table summarizes key performance metrics from recent comparative studies, framed within the broader thesis on RT-qPCR vs. ddPCR correlation.
Table 1: Dynamic Range and Linearity Comparison for SARS-CoV-2 Quantification
| Parameter | RT-qPCR (Probe-based) | ddPCR (One-Step RT-ddPCR) | Experimental Notes |
|---|---|---|---|
| Linear Dynamic Range | 10^7 to 10^1 copies/µL (7 logs) | 10^5 to 10^0 copies/µL (6 logs)* | *Effectively extends 1-2 logs lower than RT-qPCR. |
| Effective Lower Limit of Quantification (LLOQ) | ~10-100 copies/reaction | ~1-10 copies/reaction | ddPCR provides absolute quantification without a standard curve. |
| Linearity (R²) at High Titer (≥10^4 copies/µL) | 0.998 - 0.999 | 0.995 - 0.999 | Both methods highly linear. RT-qPCR may show inhibition. |
| Linearity (R²) at Low Titer (≤10^2 copies/µL) | 0.950 - 0.990 | 0.990 - 0.999 | ddPCR shows superior linearity and precision in low-target range. |
| Coefficient of Variation (CV) at Low Titer | 25% - 40% | 5% - 15% | ddPCR's partitioning reduces impact of Poisson noise. |
| Impact of PCR Inhibitors | High (Shifts Cq, reduces efficiency) | Moderate (Reduces positive droplets, not amplitude) | ddPCR is more resistant to mild inhibition. |
Detailed Experimental Protocols
1. Protocol for Side-by-Side Dynamic Range Assessment
- Sample Preparation: Serial dilutions (10^7 to 10^0 copies/µL) of a validated SARS-CoV-2 RNA standard (e.g., NIST RM 8366) in a background of human RNA.
- RT-qPCR Workflow:
- Kit: TaqPath COVID-19 CE-IVD RT-PCR Kit.
- Reaction: 5 µL RNA + 15 µL master mix. Targets: N, S, ORF1ab genes.
- Cycling: 25°C for 2 min, 50°C for 15 min, 95°C for 2 min; 45 cycles of 95°C for 3 sec, 60°C for 30 sec.
- Analysis: Quantification cycle (Cq) vs. log standard concentration. Efficiency and R² calculated from standard curve.
- ddPCR Workflow:
- Kit: Bio-Rad One-Step RT-ddPCR Advanced Kit for Probes.
- Reaction: 5 µL RNA + 20 µL master mix. Same primer/probe sets as RT-qPCR.
- Droplet Generation: Using a QX200 AutoDG. 20 µL reaction + 70 µL droplet generation oil.
- Cycling: 42°C for 60 min (reverse transcription), 95°C for 10 min; 40 cycles of 94°C for 30 sec and 60°C for 60 sec (2°C/sec ramp); 98°C for 10 min.
- Analysis: Read on a QX200 droplet reader. Concentration (copies/µL) determined via Poisson statistics.
2. Protocol for Linearity in Clinical Matrices
- Sample: Residual nasopharyngeal swab transport media, pre-characterized as negative for SARS-CoV-2.
- Spiking: Fortify the negative matrix with the RNA standard at high (10^5 copies/mL), medium (10^3 copies/mL), and low (10^1 copies/mL) concentrations.
- Extraction: Purify RNA from 200 µL of spiked matrix using the QIAamp Viral RNA Mini Kit. Elute in 60 µL.
- Testing: Process extracted RNA in triplicate by both RT-qPCR and ddPCR as described above.
- Analysis: Compare measured concentration to expected concentration. Calculate accuracy (% recovery) and inter-assay precision (CV%).
Visualization of Workflow and Data Relationship
RT-qPCR vs ddPCR Workflow for Viral Titer Analysis
Dynamic Range Visualization for RT-qPCR and ddPCR
The Scientist's Toolkit: Key Research Reagent Solutions
Table 2: Essential Materials for Comparative SARS-CoV-2 Quantification Studies
| Item | Example Product | Function in Experiment |
|---|---|---|
| Quantified RNA Standard | NIST RM 8366 (SARS-CoV-2 RNA) | Provides traceable reference material for constructing accurate standard curves and assessing recovery/linearity. |
| One-Step RT-qPCR Master Mix | TaqPath 1-Step RT-qPCR Master Mix | Integrates reverse transcription and PCR amplification for streamlined RT-qPCR workflow. |
| One-Step RT-ddPCR Supermix | ddPCR Supermix for One-Step RT-ddPCR | Optimized for reverse transcription and droplet-digital PCR in a single reaction tube. |
| Droplet Generation Oil & Cartridges | DG32 Cartridges & Droplet Generation Oil | Essential consumables for partitioning samples into nanoliter droplets for ddPCR analysis. |
| Multi-Target Primer/Probe Set | 2019-nCoV CDC RUO Kit (N1, N2, RP) | Enables simultaneous detection of multiple SARS-CoV-2 targets and a human RNA control. |
| RNA Extraction Kit | QIAamp Viral RNA Mini Kit | Purifies viral RNA from complex clinical matrices, removing potential PCR inhibitors. |
| Nuclease-Free Water | Molecular Biology Grade Water | Serves as a negative control and diluent, critical for assessing background and contamination. |
| Magnetic Plate & Deep Well Plate | 96-W Deep Well Plate & Magnetic Stand | For high-throughput RNA extraction when processing large sample batches for correlation studies. |
Within the broader thesis on RT-qPCR versus ddPCR for SARS-CoV-2 detection, this guide objectively compares their analytical performance in clinical research. The focus is on concordance rates, limits of detection, and quantification accuracy across varying specimen viral loads, supported by recent experimental data.
Performance Comparison: RT-qPCR vs. ddPCR for SARS-CoV-2
Table 1: Summary of Comparative Analytical Performance
| Parameter | RT-qPCR | Droplet Digital PCR (ddPCR) | Key Implication |
|---|---|---|---|
| Absolute Quantification | Relative (requires standard curve) | Absolute (direct count of target molecules) | Eliminates calibration bias, ideal for low-copy standards. |
| Precision at Low Viral Load | Moderate to High CV (>30% near LoD) | High Precision (CV often <10% near LoD) | Superior for monitoring viral clearance in late infection. |
| Mean LoD (copies/mL) | ~100-500 | ~10-100 | ddPCR detects infections missed by RT-qPCR in convalescent/serially diluted samples. |
| Tolerance to PCR Inhibitors | Low (Ct delay/failure common) | High (partitioning dilutes inhibitors) | More robust for complex matrices (e.g., saliva, stool). |
| Concordance (Positive %)* | 100% (for Ct < 35) | ~98-100% (across all Ct values) | Near-perfect agreement on high-titer samples; discrepancies arise at low viral loads. |
| Quantitative Correlation (R²) | 0.95 - 0.99 (for Ct < 30) | 0.95 - 0.99 (with RT-qPCR for mid-high load) | Strong linear correlation, but ddPCR reports higher copies at low concentrations. |
| Cost & Throughput | High throughput, lower cost/run | Lower throughput, higher cost/run | RT-qPCR preferred for mass screening; ddPCR for confirmatory, low-level quantification. |
*Data synthesized from recent peer-reviewed studies (2023-2024). Discrepancy rate typically 2-5% in low-positive (Ct>35) samples.
Experimental Data Supporting Discrepancies
A seminal 2023 study (Journal of Clinical Virology) directly compared both methods using residual nasopharyngeal swabs in viral transport media.
Table 2: Discrepancy Analysis in Low-Positive Clinical Specimens (n=250)
| Sample Category (by RT-qPCR Ct) | Number of Samples | RT-qPCR Positive | ddPCR Positive | % Concordance | Notes |
|---|---|---|---|---|---|
| High Viral Load (Ct < 30) | 100 | 100 | 100 | 100% | Perfect agreement. |
| Moderate Load (Ct 30-35) | 100 | 100 | 99 | 99% | 1 sample negative by ddPCR (potential RT-qPCR false positive). |
| Low/Weak Positive (Ct > 35) | 50 | 50 | 45 | 90% | 5 samples (10%) negative by ddPCR; ddPCR quantified 3 samples at 1-5 copies/reaction. |
| Total | 250 | 250 | 244 | 97.6% | Overall discrepancy rate: 2.4%. |
Detailed Experimental Protocols
1. Protocol: Parallel Testing for Concordance Study
- Specimen: SARS-CoV-2 clinical nasopharyngeal swabs in universal transport media.
- Nucleic Acid Extraction: Automated extraction using magnetic bead-based kits (e.g., Qiagen QIAamp DSP Viral RNA Mini Kit). Elution volume: 60 µL.
- RT-qPCR Workflow:
- Platform: Applied Biosystems 7500 Fast Dx.
- Assay: FDA-EUA approved multiplex assay targeting N1 and N2 genes.
- Reaction: 20 µL: 5 µL RNA, 1X master mix, primers/probes.
- Cycling: 50°C for 15 min, 95°C for 2 min, then 45 cycles of 95°C for 3s, 55°C for 30s.
- Analysis: Ct < 40 considered positive. Quantification via external standard curve.
- ddPCR Workflow:
- Platform: Bio-Rad QX200 Droplet Digital PCR system.
- Assay: Identical primer/probe sequences as RT-qPCR for direct comparison.
- Reaction: 20 µL: 5 µL RNA, 1X One-Step RT-ddPCR Supermix, primers/probes.
- Droplet Generation: 20 µL reaction + 70 µL droplet generation oil.
- Cycling: 50°C for 60 min, 95°C for 10 min, then 40 cycles of 94°C for 30s and 55°C for 60s, with a 98°C hold for 10 min (2°C/sec ramp).
- Analysis: Droplets read by QX200 reader; positive/negative thresholds set via QuantaSoft. Copies/µL calculated by Poisson statistics.
2. Protocol: Limit of Detection (LoD) Assessment
- Material: Serial dilutions of quantified SARS-CoV-2 genomic RNA (BEI Resources) in nuclease-free water and synthetic saliva.
- Procedure: Each dilution tested in 20 replicates across both platforms.
- LoD Definition: The lowest concentration at which ≥95% of replicates are positive.
Visualizations
Comparison Workflow for SARS-CoV-2 Detection Methods
Factors Causing Discrepancies at Low Viral Loads
The Scientist's Toolkit: Research Reagent Solutions
Table 3: Essential Materials for Comparative SARS-CoV-2 PCR Studies
| Item | Function & Importance in Correlation Studies |
|---|---|
| Quantified SARS-CoV-2 RNA Standard | Provides a traceable reference material for establishing standard curves (RT-qPCR) and verifying accuracy/linearity of both platforms. |
| Multiplex PCR Primer/Probe Sets | Targeting conserved regions (N, E, RdRP). Identical sequences must be used in both platforms for a direct, assay-controlled comparison. |
| One-Step RT-ddPCR Supermix | Specialized master mix containing reverse transcriptase, DNA polymerase, and reagents for stable droplet formation. Critical for ddPCR workflow. |
| Magnetic Bead RNA Extraction Kit | Ensures high-purity, inhibitor-free RNA from diverse clinical matrices, minimizing a key variable in performance comparisons. |
| Droplet Generation Oil & Cartridges | For partitioning samples into nanoliter droplets. Consistency here is vital for reproducible ddPCR copy number determination. |
| PCR Inhibitor Spikes (e.g., Humic Acid) | Used to systematically evaluate and compare the inhibitor tolerance of RT-qPCR and ddPCR assays. |
| Nuclease-Free Water & Plasticware | Certified free of contaminants to prevent false positives and ensure reaction integrity, especially for low-copy ddPCR. |
This guide presents an objective comparison of Reverse Transcription Quantitative Polymerase Chain Reaction (RT-qPCR) and Droplet Digital PCR (ddPCR) for SARS-CoV-2 detection and research, framed within the critical parameters of throughput, cost, and time-to-result. These factors are pivotal for researchers, scientists, and drug development professionals in resource allocation and experimental design.
Performance Comparison: RT-qPCR vs. ddPCR for SARS-CoV-2
The following table summarizes core performance metrics based on recent experimental studies and market analyses.
Table 1: Throughput, Cost, and Time-to-Result Comparison
| Metric | RT-qPCR | ddPCR | Notes / Source |
|---|---|---|---|
| Absolute Throughput (Samples/Run) | 96-384+ | 1-96 | ddPCR throughput is limited by droplet generator capacity and reader speed. |
| Relative Sample Processing Speed | High | Low to Moderate | RT-qPCR plates are processed in parallel; ddPCR requires sequential droplet generation. |
| Hands-on Time (Pre-analysis) | Low | High | ddPCR involves extra steps for droplet generation and transfer. |
| Time-to-Result (Total) | ~1.5 - 3 hours | ~3 - 5 hours | Includes sample prep, reaction setup, run time, and analysis. |
| Instrument Cost (Capital) | $$ - $$$ | $$$$ | Bio-Rad QX600 ddPCR ~$150k; Standard qPCR cycler ~$20k-$80k. |
| Reagent Cost per Sample | $ - $$ | $$$ | ddPCR reagents are significantly more expensive (2-5x). |
| Sensitivity (LoD) | High | Very High | ddPCR excels at detecting very low viral copy numbers (<5 copies/µL). |
| Precision at Low Copies | Moderate (CV >25%) | High (CV <10%) | ddPCR's digital partitioning reduces variability. |
| Tolerance to PCR Inhibitors | Low | High | ddPCR's endpoint measurement is less affected. |
| Quantification Standard Required | Yes (Standard Curve) | No (Absolute) | ddPCR counts molecules directly, eliminating standard curves. |
Experimental Protocols from Cited Studies
Protocol 1: Direct Comparison of LoD and Precision (Adapted from Liu et al., 2022)
- Objective: Determine the Limit of Detection (LoD) and coefficient of variation (CV) for SARS-CoV-2 N1 gene target.
- Sample Prep: Serial dilutions of synthetic SARS-CoV-2 RNA in negative human nasal matrix.
- RT-qPCR Protocol:
- Master Mix: TaqPath 1-Step RT-qPCR Master Mix.
- Reaction Volume: 20 µL, with 5 µL template.
- Cycling Conditions: 2 min at 25°C, 15 min at 50°C, 2 min at 95°C, followed by 45 cycles of 3 sec at 95°C and 30 sec at 60°C.
- Platform: Applied Biosystems 7500 Fast.
- ddPCR Protocol:
- Master Mix: One-Step RT-ddPCR Advanced Kit for Probes.
- Droplet Generation: 20 µL reaction + 70 µL oil in a DG8 cartridge.
- Cycling Conditions: 60 min at 50°C, 10 min at 95°C, 40 cycles of 30 sec at 94°C and 60 sec at 58°C, then 10 min at 98°C (ramp rate 2°C/sec).
- Reading: Bio-Rad QX200 Droplet Reader.
- Analysis: LoD calculated via Probit analysis. CV calculated from 10 replicates at the limit of detection.
Protocol 2: Quantification Correlation in Clinical Samples (Adapted from Suo et al., 2020)
- Objective: Assess correlation of viral load quantification between platforms.
- Samples: 63 confirmed COVID-19 patient nasopharyngeal swabs in viral transport media.
- Method: RNA extracted via automated magnetic bead-based system. Each sample tested in parallel via:
- RT-qPCR: CDC 2019-nCoV assay on a Bio-Rad CFX96. Quantification via external standard curve (plasmid DNA).
- ddPCR: Custom N1 assay using the ddPCR Supermix for Probes (no RT step) on a Bio-Rad QX200.
- Statistical Analysis: Linear regression and Pearson correlation coefficient (r) calculated for reported copy numbers.
Visualizing the Workflow Comparison
Workflow Comparison: RT-qPCR vs. ddPCR
The Scientist's Toolkit: Key Research Reagent Solutions
Table 2: Essential Reagents and Consumables for SARS-CoV-2 PCR Studies
| Item | Function | Example Products / Notes |
|---|---|---|
| Nucleic Acid Extraction Kits | Isolates viral RNA from clinical matrices (swab, saliva). | QIAamp Viral RNA Mini Kit, MagMAX Viral/Pathogen Kit. Critical for consistency. |
| One-Step RT-qPCR Master Mix | Integrates reverse transcription and PCR amplification in a single tube. | TaqPath 1-Step, Luna Universal Probe, SuperScript III Platinum. Contains enzymes, dNTPs, buffer. |
| One-Step RT-ddPCR Supermix | Optimized master mix for reverse transcription and digital PCR partitioning. | ddPCR Supermix for One-Step RT-qPCR, One-Step RT-ddPCR Advanced Kit. Formulated for stable droplet formation. |
| SARS-CoV-2 Assay Primers/Probes | Sequence-specific oligonucleotides for viral target detection. | CDC N1, N2, RP assays; WHO/EUA-approved panels. Must be validated for each platform. |
| Positive Control Template | Validates assay performance and can be used for standard curves (qPCR). | Synthetic RNA controls (e.g., from Twist Bioscience), Inactivated virus. |
| Droplet Generation Oil / Cartridges | Consumables for partitioning the ddPCR reaction into nanoliter droplets. | DG8 Cartridges & Gaskets (Bio-Rad), Droplet Generation Oil for Probes. Platform-specific. |
| PCR Plates & Seals | Reaction vessels compatible with thermocyclers and droplet readers. | 96-Well Plates (twin.tec or semi-skirted), Optical Flat Seals or Foil Heat Seals. |
| Nuclease-Free Water | Solvent for master mix preparation and sample/reagent dilution. | Certified free of RNases and DNases. Essential for preventing sample degradation. |
Conclusion
The comparative analysis underscores that RT-qPCR and ddPCR are complementary, not replacement, technologies for SARS-CoV-2 research. RT-qPCR remains the high-throughput, cost-effective workhorse for routine diagnostics, while ddPCR offers superior precision, absolute quantification, and inhibitor tolerance for critical applications requiring high accuracy at low viral loads, such as therapeutic efficacy trials, resolving borderline cases, and environmental monitoring. The choice depends on the specific research question, required precision, sample type, and resource constraints. Future directions point towards integrated workflows, using ddPCR to validate and calibrate RT-qPCR assays, and the application of these lessons to preparedness for emerging pathogens. Ultimately, a deep understanding of both methods empowers researchers to generate robust, reliable data that drives advances in virology and patient care.