Viral Nucleic Acid Testing (NAT): Protocols, Applications, and Advances in Molecular Diagnostics
This article provides a comprehensive overview of viral Nucleic Acid Testing (NAT) protocols for researchers, scientists, and drug development professionals.
Viral Nucleic Acid Testing (NAT): Protocols, Applications, and Advances in Molecular Diagnostics
Abstract
This article provides a comprehensive overview of viral Nucleic Acid Testing (NAT) protocols for researchers, scientists, and drug development professionals. It explores the foundational principles of NAT, including its critical role in shortening the diagnostic window period for viruses like HIV, HBV, and HCV. The scope extends to detailed methodological approaches such as qRT-PCR, isothermal amplification, and high-throughput sequencing, with applications in clinical diagnostics, blood safety, and vaccine development. The content also addresses common challenges, optimization strategies for sensitivity and specificity, and a comparative analysis of commercial platforms and regulatory standards. This resource synthesizes current knowledge and future directions to guide research and implementation in biomedical science.
The Principles and Significance of Viral Nucleic Acid Testing
Nucleic Acid Testing (NAT) represents a group of techniques used to detect a specific nucleic acid sequence, thereby identifying a particular species or subspecies of an organism, most commonly viruses or bacteria that act as pathogens in clinical samples such as blood, tissue, or urine [1]. The fundamental principle that distinguishes NATs from other diagnostic methods (like antigen or antibody tests) is their direct targeting of genetic material—either DNA or RNA [1]. This approach allows for the early diagnosis of infectious diseases because it does not rely on the host's immune response; the detection of antigens or antibodies requires time for them to appear in the bloodstream in detectable quantities [1].
The core of virtually all nucleic acid detection technologies is the specificity of Watson-Crick base pairing, where single-stranded probe molecules are designed to bind exclusively to complementary DNA or RNA target sequences [1]. Since the amount of a specific genetic material in a sample is often minimal, many NATs incorporate an amplification step, classifying them as Nucleic Acid Amplification Tests (NAATs) [1]. Prominent examples of amplification methods include the polymerase chain reaction (PCR), transcription-mediated assay (TMA), and loop-mediated isothermal amplification (LAMP) [1].
Core Principles and Methodologies
The effectiveness of NAT hinges on several foundational principles and a workflow that ensures specificity and sensitivity.
The Principle of Hybridization and Probe Design
The process of nucleic acid strands with complementary sequences binding together is called hybridization [1]. However, achieving perfect specificity, especially to distinguish between sequences that differ by only a single base (as in Single-Nucleotide Polymorphisms, or SNPs), is a critical challenge. Imperfect probe-target binding can lead to false-positive results [1]. Research has led to advanced probe designs, such as the toehold exchange probe, which consists of a longer complement strand pre-hybridized to a shorter protector strand [1]. When the correct target sequence is present, it binds to the exposed "toehold" region and displaces the protector strand, forming a stable product. Reactions with spurious targets are thermodynamically less favorable, providing high discrimination factors that can range from 3 to over 100, enabling robust detection even in the presence of single-base changes [1].
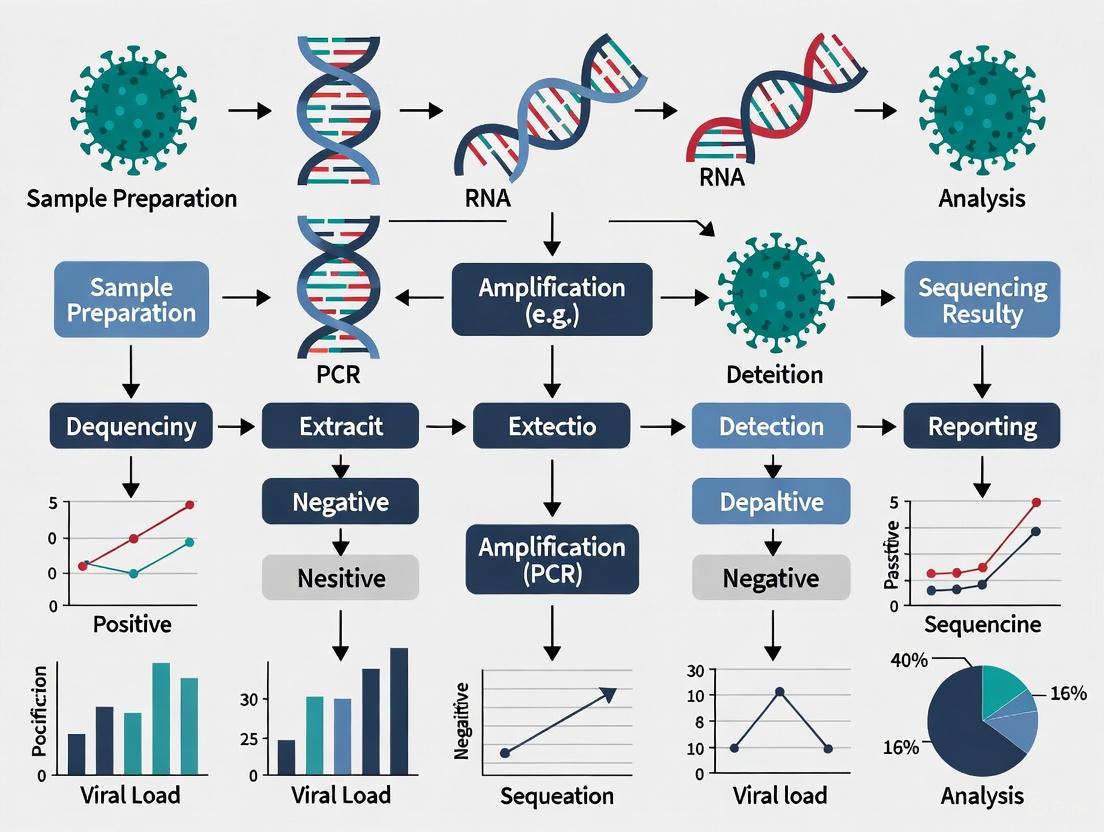
General Workflow for Viral Pathogen Detection
The following diagram illustrates a generalized workflow for detecting a viral pathogen using nucleic acid testing, from sample collection to result interpretation.
Key Research Reagent Solutions
Successful execution of a NAT protocol depends on a suite of critical reagents and materials. The following table details these essential components and their functions.
Table 1: Essential Research Reagents for Nucleic Acid Testing
| Reagent / Material | Function / Explanation |
|---|---|
| Specific Primers & Probes | Short, single-stranded DNA sequences designed to be complementary to and hybridize with a unique target sequence in the pathogen's genome, providing the test's specificity [1]. |
| Reverse Transcriptase (RT) | An enzyme used in tests for RNA viruses (e.g., SARS-CoV-2). It transcribes RNA into complementary DNA (cDNA), which can then be amplified by PCR [2]. |
| DNA/RNA Polymerase | A thermostable enzyme that synthesizes new strands of DNA by adding nucleotides to the primer, enabling the exponential amplification of the target sequence during PCR or isothermal amplification [1] [2]. |
| Nucleotides (dNTPs) | The fundamental building blocks (dATP, dCTP, dGTP, dTTP) used by the polymerase enzyme to build new DNA strands [2]. |
| Buffer Solutions | Provide the optimal chemical environment (pH, ionic strength, co-factors like Mg²⁺) for the enzymatic reactions to proceed efficiently and with high fidelity [2]. |
| Sample Lysis Buffer | A chemical solution used to break open (lyse) cells or viral particles in the collected sample, releasing the nucleic acids for extraction and purification [1]. |
Application Note: SARS-CoV-2 Detection Paradigm
The COVID-19 pandemic served as a catalyst for the advancement and large-scale application of NAT, providing a clear case study of its utility.
The Gold Standard and Its Limitations
For SARS-CoV-2, the Real-Time Reverse Transcription-Polymerase Chain Reaction (rRT-PCR or RT-PCR) was established as the gold-standard NAAT [3]. Despite its high sensitivity and specificity, its reliance on specialized laboratory equipment, skilled personnel, and the potential for long turnaround times (up to 72 hours) highlighted critical logistical challenges during a rapidly evolving pandemic [3].
Next-Generation NAT Platforms
In response to these limitations, significant research efforts were directed toward developing faster, more affordable, and user-friendly platforms. Key innovations include [3]:
- CRISPR-Cas Systems: These platforms combine the sensitivity of amplification with the programmability and specificity of CRISPR-Cas enzymes. When integrated with isothermal amplification methods like Recombinase Polymerase Amplification (RPA), they allow for rapid, visual detection of viral RNA.
- Isothermal Amplification Techniques: Methods such as LAMP and RPA amplify nucleic acids at a constant temperature, eliminating the need for expensive thermal cyclers and making them more suitable for point-of-care settings.
- Portable Biosensors: These devices aim to integrate sample processing, amplification, and detection into a miniaturized, portable format for use in field or community settings.
Algorithmic Comparison of Testing Strategies
Public health organizations recommended various strategies for deploying NAATs alongside rapid antigen tests. A quantitative simulation model compared the outcomes of six different testing algorithms in a population of 100,000 individuals, revealing key trade-offs between missed cases, false positives, and test volumes [4] [5].
Table 2: Simulated Outcomes of SARS-CoV-2 Testing Algorithms at 10% Prevalence
| Testing Algorithm | Missed Cases (Median) | False-Positive Diagnoses (Median) | Total NAATs Required* |
|---|---|---|---|
| A) NAAT Only | 0 | 0 | 100,000 |
| B) Antigen (Ag) Only | 2,830 | 635 | 0 |
| C) NAAT for Sx/Ag-neg & Asx/Ag-pos | 1,409 | 13 | 33,200 |
| D) NAAT Confirmation of All Ag-neg | 0 | 635 | 92,200 |
| E) Repeat Ag for Ag-neg | 2,280 | 635 | 0 |
| F) NAAT for Asx & Sx/Ag-pos | 1,389 | 13 | 66,700 |
*In addition to 100,000 antigen tests for algorithms B, C, D, and E. Sx: Symptomatic; Asx: Asymptomatic; Ag-neg: Antigen Negative; Ag-pos: Antigen Positive. Data adapted from [4] [5].
The analysis concluded that no single algorithm is optimal for all settings. The choice depends on programmatic priorities: maximizing case detection (Algorithm A or D), conserving NAAT resources (Algorithm B or E), or seeking an efficient balance (Algorithm C) [4] [5]. Algorithm C, which uses NAATs to confirm results that are discordant with symptom status (e.g., a symptomatic person with a negative antigen test), was found to be the most efficient, requiring 25 NAATs to detect one additional case compared to using antigen tests alone [5].
Detailed Protocol: Detection of Viral RNA via RT-PCR
This protocol provides a step-by-step methodology for detecting the presence of viral RNA from a nasopharyngeal swab sample using RT-PCR, the gold-standard technique for pathogens like SARS-CoV-2 [3] [2].
Principle
The protocol involves the reverse transcription of viral RNA into complementary DNA (cDNA), followed by the polymerase chain reaction amplification of a specific target sequence within the cDNA. The amplification is monitored in "real-time" using fluorescently labeled probes, allowing for both detection and quantification of the viral load [2].
Specimen Collection and Handling
- Collection: Using a sterile synthetic swab (e.g., polyester), collect a sample from the nasopharynx. Place the swab immediately into a tube containing 2-3 mL of viral transport media [3].
- Storage: Store samples at 2-8°C and process within 72 hours. For longer storage, keep at -70°C or below to preserve RNA integrity.
- Safety: Handle all samples as potentially infectious under appropriate biosafety level (BSL-2 or higher) conditions.
Procedure
- Nucleic Acid Extraction: Using a commercial RNA extraction kit, purify the viral RNA from 200 µL of the transport media. This typically involves a combination of lysis, binding to a silica membrane, washing, and elution into 50-100 µL of nuclease-free water. This step removes inhibitors that could affect the downstream reaction.
Master Mix Preparation: In a dedicated, clean area, prepare the RT-PCR reaction mix on ice. The following table details the components for a single 20 µL reaction.
Table 3: RT-PCR Reaction Master Mix
Component Final Concentration/Amount Function 2X RT-PCR Reaction Mix 10 µL Contains buffer, dNTPs, and Mg²⁺ Forward Primer (e.g., N gene) 0.5 µM Binds to one strand of the target Reverse Primer (e.g., N gene) 0.5 µM Binds to the complementary strand TaqMan Probe (FAM-labeled) 0.2 µM Fluorescent probe for detection Reverse Transcriptase 0.5 µL Converts RNA to cDNA Hot-Start DNA Polymerase 0.5 U Amplifies cDNA Nuclease-Free Water To 18 µL Solvent Template RNA 2 µL The extracted sample RNA - Plate Setup: Pipette 18 µL of the master mix into each well of a 96-well PCR plate. Add 2 µL of the extracted RNA sample to the respective wells. Include positive controls (synthetic viral RNA) and negative controls (nuclease-free water) in each run. Seal the plate with an optical adhesive cover.
RT-PCR Amplification: Place the plate in a real-time PCR instrument and run the following program.
Table 4: Thermal Cycling Conditions
Step Temperature Time Cycles Purpose Reverse Transcription 50°C 15-30 minutes 1 Synthesis of cDNA from RNA Initial Denaturation 95°C 2-5 minutes 1 Activates polymerase, denatures cDNA Amplification 95°C 15-30 seconds 40-45 Denaturation 55-60°C 30-60 seconds Primer annealing & extensionFluorescence data collection
Data Analysis
- Cycle Threshold (Ct): The primary output is the Ct value, which is the number of cycles required for the fluorescence signal to cross a predetermined threshold.
- Interpretation: A sample is generally considered positive if it produces exponential amplification with a Ct value below a validated cut-off (e.g., Ct < 40). The negative control must show no amplification, and the positive control must amplify with an expected Ct value for the run to be considered valid.
Advanced Techniques and Future Directions
The field of nucleic acid detection continues to evolve, driven by the need for greater speed, simplicity, and accessibility.
Isothermal Amplification and Blocker Displacement Amplification (BDA)
Isothermal techniques, such as Loop-mediated Isothermal Amplification (LAMP), provide an alternative to PCR by operating at a single temperature, facilitating point-of-care use [1]. Furthermore, advanced methods like Blocker Displacement Amplification (BDA) have been developed to address the challenge of detecting rare DNA variants [1]. BDA is a modified PCR method that can selectively amplify sequence variants present at very low frequencies (≤ 0.1% allele frequency) by 1000-fold over wildtype sequences. This technique is particularly robust across a range of annealing temperatures (56°C to 64°C), making it suitable for multiplexed enrichment of various genomic variants and for use with portable thermocyclers [1].
Biosafety and Synthesis Screening
As nucleic acid technologies advance, including the ability to synthesize nucleic acids de novo, regulatory frameworks are adapting to address biosecurity concerns. A key development is the forthcoming Framework for Nucleic Acid Synthesis Screening, which will require, as a federal funding condition, that purchases of synthetic nucleic acids or synthesis equipment be made only from providers that screen orders for sequences of concern to prevent potential misuse [6]. This highlights the growing importance of security considerations in nucleic acid research.
Nucleic Acid Amplification Testing (NAT) has revolutionized blood safety by dramatically reducing the diagnostic window period for major transfusion-transmitted viruses (TTVs), including Human Immunodeficiency Virus (HIV), Hepatitis B Virus (HBV), and Hepatitis C Virus (HCV). This application note details the critical advantage of NAT over serological assays by directly detecting viral genomic material, thereby identifying infections during the pre-seroconversion phase. Within the context of advanced viral NAT protocol research, we provide a comprehensive summary of quantitative efficacy data, detailed experimental methodologies, and essential reagent solutions to support researchers and scientists in implementing and optimizing NAT for viral pathogen screening.
The window period in viral diagnostics is the critical time interval between infection and the detectability of a pathogen by a specific assay. During this period, traditional serological tests, which rely on detecting host-generated antibodies (e.g., anti-HCV, anti-HIV) or viral antigens (e.g., HBsAg, HIV p24), yield false-negative results despite the individual being infectious [7]. This gap represented a significant residual risk for transfusion-transmitted infections.
The introduction of Nucleic Acid Amplification Testing (NAT) marked a paradigm shift. By directly targeting and amplifying viral nucleic acids (RNA or DNA), NAT can detect the presence of a pathogen days to weeks before serological markers become apparent [8]. For the blood supply, this has been transformative. The mid-to-late 1990s saw the driving force for NAT implementation: the AIDS and HCV epidemics, which resulted in thousands of infections from contaminated blood products [8]. Initially adopted by plasma fractionators, NAT has since become a cornerstone for screening labile blood components worldwide, reducing the residual risk of virus transmission to almost zero [8].
This document provides a structured overview of NAT's performance data, outlines core protocols for its application in screening for HIV, HBV, and HCV, and equips researchers with the essential toolkit for its implementation.
Quantitative Data: Comparative Efficacy of NAT vs. Serology
The superior sensitivity of NAT is quantitatively demonstrated through large-scale screening studies, which reveal infections missed by serological methods.
Table 1: NAT Yield in Blood Donor Screening: Detection of Serology-Negative Infections
| Virus | Study Location (Sample Size) | Serology-Negative, NAT-Positive Yield (per million donations) | Probable Interpretation | Reference |
|---|---|---|---|---|
| HCV | Germany (430,000 donations) | 51.2 | Early acute infection (Window Period) | [8] |
| HBV | China, Zhejiang (1.16 million donations) | 624.6 - 1669.5 | Window Period & Occult HBV Infection (OBI) | [9] |
| HIV | Egypt (87,620 donations) | 0.2 | Early acute infection (Window Period) | [7] |
These "NAT yield" cases represent donations that were infectious but would have been released for transfusion if relying solely on serological testing. A recent comparative analysis from Egypt further underscores the accuracy of NAT, showing near-perfect agreement with chemiluminescence immunoassay (CLIA) but with the distinct advantage of identifying pre-seroconversion and occult infections [7].
Table 2: Comparative Analysis of CLIA vs. NAT in Blood Donor Screening (n=87,620)
| Virus | CLIA Reactive | NAT Reactive | True Positive | False Positive (CLIA) | False Negative (CLIA) |
|---|---|---|---|---|---|
| HBV | 676 | 621 | 589 | 87 | 32 |
| HCV | 1,477 | 1,328 | 1,305 | 172 | 23 |
| HIV | 22 | 19 | 19 | 3 | 0 |
| Accuracy (CLIA vs NAT) | HBV: 99.86% | HCV: 99.78% | HIV: 100% |
Data adapted from a study in two Egyptian university blood transfusion centers [7].
Experimental Protocols
Core NAT Screening Workflow for HIV, HBV, and HCV
The following protocol outlines the standard operating procedure for multiplex NAT screening of blood donations using automated platforms.
1. Sample Collection and Preparation
- Collection: Draw whole blood from voluntary donors into sterile collection tubes containing EDTA or other appropriate anticoagulants.
- Processing: Centrifuge blood samples to separate plasma within 24 hours of collection. Store plasma at 2-8°C if testing within 48 hours; otherwise, freeze at ≤ -20°C.
- Quality Check: Ensure samples are non-hemolyzed and non-lipemic.
2. Nucleic Acid Extraction and Purification
- Method: Utilize automated nucleic acid extraction systems (e.g., on the Cobas S201 or 6800/8800 systems).
- Procedure: Extract viral nucleic acid (RNA/DNA) from 500 µL to 1 mL of plasma sample using magnetic bead-based or silica membrane-based kits. The process includes lysis, binding, washing, and elution steps. The final elution volume is typically 50-100 µL.
- Internal Control: Co-extract an exogenous Internal Control (IC) added to each sample lysis buffer to monitor extraction efficiency and detect PCR inhibition.
3. Target Amplification and Detection (Real-Time PCR/TMA)
- Technology Choice A (Real-Time PCR):
- Reverse Transcription (for HIV/HCV): Convert viral RNA to complementary DNA (cDNA) using reverse transcriptase and specific primers or a blend of random hexamers and target-specific primers.
- Amplification: Perform multiplex real-time PCR using target-specific primers and probes for HBV DNA, HCV RNA, and HIV RNA. Probes are labeled with different fluorophores (e.g., FAM for HBV, HEX/VIC for HCV, Cy5 for HIV).
- Detection: Monitor fluorescence in real-time. A signal that crosses the threshold cycle (Ct) within the validated range indicates a reactive sample.
- Technology Choice B (Transcription-Mediated Amplification - TMA):
- Primer Binding: Specific primers target the rRNA or mRNA of the viruses.
- Amplification: Utilize reverse transcriptase to create a DNA copy, followed by RNA polymerase to generate multiple RNA amplicons.
- Detection: Use hybridization protection assay (HPA) or other chemiluminescent methods to detect amplicons.
4. Data Analysis and Interpretation
- Software Analysis: The platform's integrated software automatically analyzes amplification curves and calculates Ct values.
- Interpretation:
- Non-Reactive: No amplification curve for any viral target, with valid IC amplification.
- Reactive: Specific amplification curve for one or more viral targets, with valid IC amplification.
- Invalid: Failure of the IC amplification, requiring sample retest.
5. Confirmatory and Discriminatory Testing
- Procedure: Initially reactive samples are retested in duplicate from the original specimen.
- Discrimination: Reactive samples are tested with discriminatory NAT assays (single-plex or duplex) to identify the specific virus(es) present.
- Serological Correlation: NAT-reactive samples are further investigated with supplementary serological (e.g., CLIA, ECLIA) and viral load assays to characterize the infection stage (e.g., window period, OBI) [10] [9].
Supplementary Serological Characterization
- Objective: To determine the serological profile of NAT yield samples.
- Method: Use Chemiluminescent Microparticle Immunoassay (CMIA) on platforms like the ARCHITECT i2000SR or Electrochemiluminescence Immunoassay (ECLIA) on Cobas e601 analyzers.
- Targets:
- HBV Profile: HBsAg, anti-HBs, HBeAg, anti-HBe, anti-HBc.
- HCV Profile: Anti-HCV.
- HIV Profile: HIV Ag/Ab combo.
- Interpretation: NAT+/HBsAg- samples are classified as OBI; NAT+/anti-HCV- or NAT+/HIV Ag/Ab- samples are classified as window period infections [9].
Visualization of Workflows and Relationships
NAT Screening Algorithm and Window Period Advantage
The following diagram illustrates the integrated NAT and serology screening algorithm and the relative reduction in the window period.
NAT Yield Characterization Pathway
The diagram below outlines the logical pathway for characterizing a NAT-reactive, serology-negative donation.
The Scientist's Toolkit: Research Reagent Solutions
Table 3: Essential Reagents and Materials for Viral NAT Screening
| Item | Function & Application | Example Products / Kits |
|---|---|---|
| Multiplex NAT Assay Kits | For simultaneous detection and discrimination of HIV, HBV, and HCV nucleic acids in a single reaction. The core reagent for screening. | Cobas MPX (Roche), Procleix Ultrio Elite (Grifols) |
| Nucleic Acid Extraction Kits | For automated isolation and purification of viral DNA and RNA from plasma samples. Critical for removing inhibitors and concentrating target. | Cobas MPX Nucleic Acid Extraction Kit (Roche), MagNA Pure LC Total Nucleic Acid Isolation Kit (Roche) |
| Internal Controls | Non-infectious, exogenous nucleic acid sequences added to each sample to monitor extraction efficiency, reverse transcription, and amplification; crucial for validating negative results. | Included in commercial NAT kits (e.g., Cobas MPX) |
| Quantitative Viral Load Assays | For determining the concentration of viral nucleic acid (IU/mL) in a reactive sample; used for confirmatory testing and infection characterization. | Cobas TaqMan HBV Test (Roche), RealTime HCV Assay (Abbott) |
| Supplementary Serology Assays | For comprehensive serological profiling (antigens and antibodies) of NAT yield samples to distinguish window period from occult infections. | ARCHITECT HBsAg Qualitative, ARCHITECT Anti-HCV, ARCHITECT HIV Ag/Ab Combo (Abbott), Elecsys assays (Roche) |
| Quality Control Panels | Characterized positive and negative control materials used to validate assay performance, precision, and limit of detection during test runs. | WHO International Standards, Commercial Seroconversion Panels (SeraCare) |
Nucleic Acid Testing (NAT) has established itself as the gold standard for confirming active infection and enabling early diagnosis across numerous viral pathogens. This status is predicated on its direct detection of pathogen genetic material, providing exceptional sensitivity and specificity that surpasses traditional serological methods. The technology, primarily based on polymerase chain reaction (PCR), identifies DNA and RNA molecules of infectious agents at a very early stage of infection, often during the window period before antibody responses develop [11]. This capability is critical for patient outcomes and public health safety, particularly in blood and plasma donation screening, where over 60 million donations are tested daily on Roche NAT systems alone [11]. The applications of NAT extend beyond HIV, hepatitis, and other well-established targets to emerging threats like Zika virus, malaria, and babesia, demonstrating its versatile role in contemporary diagnostic paradigms [11].
Performance Data: Quantitative Analysis of NAT Applications
The superior performance of NAT is quantifiable across multiple clinical scenarios, from early infant diagnosis to blood safety screening. The following tables consolidate key performance metrics from recent research and commercial implementations.
Table 1: Clinical Impact of Early Infant Diagnosis (EID) for HIV Using NAT
| Metric | Study Findings | Significance/Outcome |
|---|---|---|
| MTCT Risk | OR: 2.9 (95% CI: 1.8-4.6) for infants without EID/ART [12] | Significantly higher transmission risk without early testing and treatment. |
| HIV Prevalence | 6.8% (95% CI: 5.2-8.4%) with early ART vs. 18.4% (95% CI: 16.0-20.8%) without [12] | Early diagnosis and treatment reduce infection prevalence in exposed infants. |
| Mortality Risk | OR: 0.24 (95% CI: 0.18-0.32) for mortality with early ART (within 3 months) [12] | 76% lower mortality risk with early diagnosis and treatment initiation. |
| Timely Testing (Nigeria) | Only 35% of exposed infants tested within recommended time frame [12] | Highlights significant implementation gap in resource-limited settings. |
| POC Testing Impact (Kenya) | OR: 2.7 (95% CI: 1.9-3.8) for receiving EID within 6 weeks with POC NAT [12] | Point-of-care NAT significantly increases uptake of early testing. |
Table 2: Performance Characteristics of Select Commercial NAT Assays
| Assay Name | Target Pathogens | Key Performance Features |
|---|---|---|
| cobas MPX | HIV-1 (Group M, O), HIV-2, HCV, HBV [11] | Detects/discriminates 3 viruses/5 targets in one assay; boosts operational efficiency. |
| cobas WNV | West Nile Virus (Lineages 1 & 2) [11] | Direct RNA detection early in infection lifecycle. |
| cobas Malaria | Plasmodium DNA and RNA [11] | Qualitative in-vitro test for malaria in whole blood. |
| cobas DPX | Parvovirus B19 (Genotypes 1-3), HAV (Genotypes I-III) [11] | Precise B19V DNA quantitation; high HAV RNA sensitivity; uses WHO traceable standard. |
| cobas Babesia | B. microti, B. duncani, B. divergens, B. venatorum [11] | First whole blood PCR test for Babesia screening. |
| cobas Zika | Zika Virus (Asian & African strains) [11] | High clinical sensitivity; FDA-approved for donor screening. |
Experimental Protocols
Protocol 1: Early Infant Diagnosis of HIV Using Dried Blood Spots and Centralized PCR
Principle: This protocol utilizes the collection of dried blood spot (DBS) samples from HIV-exposed infants for transport to a centralized laboratory where PCR-based NAT detects HIV proviral DNA or RNA [12].
Materials:
- Collection Cards: Specially treated filter paper for blood collection.
- Sterile Lancet: For heel or finger stick in infants.
- Desiccant Packs: For drying and storing DBS samples.
- Sealable Plastic Bags: For protection of samples during transport.
- Nucleic Acid Extraction Kit: For isolation of HIV nucleic acids from DBS.
- PCR Master Mix: Contains enzymes, nucleotides, and buffer for amplification.
- HIV-specific Primers/Probes: Target conserved regions of the HIV genome (e.g., pol or gag).
- Real-time PCR Instrument: For amplification and detection.
Procedure:
- Sample Collection (Week 4-6 after birth):
- Clean the infant's heel and perform a skin puncture with a sterile lancet.
- Touch the filter paper card to the blood droplet, fully saturating multiple circles.
- Air-dry the DBS card horizontally for at least 4 hours in a dust-free environment.
Sample Storage & Transport:
- Place the dried card in a sealable bag with a desiccant pack.
- Store at 2-8°C if processing within a week; for longer storage, keep at -20°C.
- Transport to the central testing laboratory via a cool chain if necessary.
Nucleic Acid Extraction:
- Punch a defined disc from the DBS into a microcentrifuge tube.
- Lyse cells and release nucleic acids using a proprietary lysis buffer.
- Purify DNA/RNA using the provided kit's magnetic beads or column-based system.
- Elute the purified nucleic acid in a small volume of nuclease-free water.
PCR Amplification & Detection:
- Prepare the reaction mix on ice: Master Mix, primers/probes, and template nucleic acid.
- Load the plate into the real-time PCR instrument.
- Run the thermocycling protocol per assay specifications (e.g., 50°C for 2 min, 95°C for 10 min, followed by 45 cycles of 95°C for 15 sec and 60°C for 1 min).
- Fluorescence is measured at the end of each annealing/extension cycle.
Result Interpretation:
- A positive result is indicated if the fluorescence signal crosses the threshold within the pre-defined cycle number, confirming HIV infection.
- The internal control must be positive for the result to be valid.
Protocol 2: High-Throughput Blood Donor Screening on Automated NAT Systems
Principle: This protocol describes the use of fully automated, high-throughput NAT systems (e.g., cobas 6800/8800 Systems) for screening individual donations or mini-pools for multiple transfusion-transmissible infections simultaneously, ensuring blood supply safety [11].
Materials:
- Automated NAT System: (e.g., cobas 6800/8800 Systems) for integrated sample processing.
- Multiplex NAT Assay: (e.g., cobas MPX assay) for simultaneous detection of HIV, HBV, and HCV.
- Sample Tubes: Primary collection tubes or secondary tubes for plasma.
- Reagent Cassettes: Pre-filled, ready-to-use, stabilized PCR reagents with RFID tracking.
- Pipette Tips & Reaction Plates: (Often provided as part of a disposable kit).
- External Controls: For quality control (positive and negative).
Procedure:
- Sample Preparation & Loading:
- Centrifuge blood collection tubes to separate plasma.
- Load primary sample tubes or aliquoted plasma samples directly into the system's sample rack.
- For pooled testing, the system can automatically combine aliquots from multiple donations (e.g., 6, 24, or 96 donations).
System Setup:
- Load the reagent cassettes and disposable tips/plates into their designated bays.
- The system's RFID reader automatically identifies and tracks reagent lots and expiration.
Automated Processing:
- The system automatically performs all subsequent steps:
- Sample Transfer: Metrically transfers sample (or pool) to a reaction plate.
- Nucleic Acid Extraction: Uses magnetic bead technology to isolate and purify nucleic acids from the plasma.
- Elution & Master Mix Setup: Elutes nucleic acids into a small volume and combines them with the PCR master mix from the reagent cassette.
- Plate Loading & Amplification: Transfers the final reaction mix to the PCR plate and initiates real-time PCR amplification.
- The system automatically performs all subsequent steps:
Amplification & Detection:
- The thermocycler runs a pre-programmed protocol with real-time fluorescence monitoring.
- The software automatically analyzes the amplification curves for each target channel.
Result Reporting & Data Management:
- The software assigns a final result (e.g., Target Not Detected, Target Detected, or Invalid) for each sample and target.
- Results, along with full process traceability data, are transmitted to the Laboratory Information System (LIS).
- For reactive samples, the system can automatically perform reflexive discriminatory testing.
Workflow Visualization
The Scientist's Toolkit: Essential Research Reagents and Materials
Table 3: Key Research Reagent Solutions for NAT Protocols
| Item | Function/Description | Example/Note |
|---|---|---|
| Multiplex NAT Assays | Simultaneously detects multiple pathogens from a single sample, increasing throughput and efficiency. | cobas MPX for HIV-1/HIV-2/HCV/HBV in one test [11]. |
| Stabilized PCR Reagents | Ready-to-use reagents that do not require thawing, mixing, or calibration, reducing hands-on time and errors. | Stabilized real-time PCR reagents on platforms like cobas 6800 [11]. |
| Internal Controls | Non-target nucleic acid sequence added to each sample to monitor extraction efficiency and PCR inhibition. | Full-process internal controls help ensure result integrity [11]. |
| External Positive Controls | Separate samples with known, quantified target used for run validation and calibration. | True external positive controls that do not affect assay calibration [11]. |
| Dried Blood Spot (DBS) Cards | Filter paper cards for simple collection, stabilization, and transport of blood samples. | Enables EID in remote areas; requires specific punching and elution protocols [12]. |
| Nucleic Acid Extraction Kits | Reagents for lysing cells and purifying DNA/RNA, free of inhibitors, for downstream PCR. | Can be manual (columns/magnetic beads) or integrated into automated systems. |
| Pathogen-Specific Primers/Probes | Short, designed nucleic acid sequences that bind to and enable detection of a specific pathogen's genome. | Critical for assay specificity; must target conserved regions to ensure broad detection. |
Nucleic Acid Testing (NAT) has revolutionized the detection and management of viral infections by offering unparalleled sensitivity and specificity. These molecular diagnostics are critical tools for public health, from tracking the emergence of SARS-CoV-2 variants to ensuring the safety of the global blood supply against pathogens like HIV, Hepatitis B (HBV), and Hepatitis C (HCV). This application note provides a detailed comparison of NAT applications across respiratory and blood-borne viruses, summarizes key quantitative findings from recent studies, and outlines standardized protocols for implementing these assays in research and clinical settings. The guidance is framed within the broader context of developing robust viral NAT protocols for both epidemic response and routine surveillance.
NAT Workflow and Quantitative Data Analysis
The core NAT workflow, from sample collection to result interpretation, is universally applicable across viral targets, though specific reagents and targets differ. The following diagram illustrates the generalized pathway for viral detection using nucleic acid amplification.
Comparative Analysis of NAT Detection Rates
The utility of NAT is particularly evident in its ability to detect infections during the serological window period. The following table synthesizes data from blood bank screenings, demonstrating the superior sensitivity of NAT compared to serological assays.
Table 1: Nucleic Acid Testing (NAT) Yield in Seronegative Blood Donors
| Virus | Study Location | Seronegative Donors Screened (N) | NAT Reactive Cases (n) | NAT Yield Rate | Rate per Million Donors |
|---|---|---|---|---|---|
| HBV | Karachi, Pakistan [13] | 43,215 | 19 | 0.044% | 1 in 2,252 |
| HCV | Karachi, Pakistan [13] | 43,215 | 4 | 0.009% | 1 in 11,111 |
| HIV | Karachi, Pakistan [13] | 43,215 | 0 | 0.000% | 0 |
| HIV | Maputo & Beira, Mozambique [14] | 2,656 | 12 | 0.452%* | 4,518 |
| HBV | Maputo & Beira, Mozambique [14] | 2,659 | 21 | 0.790%* | 7,897 |
*The higher prevalence rates in Mozambique reflect regional endemicity and highlight the critical need for NAT implementation in high-burden areas.
SARS-CoV-2 Test Attributes and Variant Resilience
For respiratory pathogens like SARS-CoV-2, assay design is critical for maintaining detection accuracy in the face of an evolving viral genome. The U.S. Food and Drug Administration (FDA) categorizes molecular tests based on their target design, which directly impacts their resilience to viral mutations [15].
Table 2: SARS-CoV-2 Molecular Diagnostic Test Attributes (Selected FDA-Authorized Assays)
| Test Name (Manufacturer/Developer) | Technology | Authorized Settings | Key Attributes | Variant Resilience |
|---|---|---|---|---|
| 3EO Health COVID-19 Test | RT-LAMP | Home, OTC | Multiple Targets, Over the Counter | More likely to perform well |
| Metrix COVID-19 Test | RT-LAMP | Home, H, M, W | Saliva, Screening, Multiple Targets | More likely to perform well |
| Xpert Xpress CoV-2/Flu/RSV plus (Cepheid) | Real-time RT-PCR | H, M, W | Multi-analyte, Multiple Targets | More likely to perform well |
| CDC 2019-nCoV RT-PCR Panel | Real-time RT-PCR | H | Pooling, Multiple Targets | More likely to perform well |
| Revogene SARS-CoV-2 | Real-time RT-PCR | H, M | Single Target | More susceptible to performance changes |
Detailed NAT Protocols
Protocol: Blood-Borne Virus Screening in Blood Donations
This protocol details the mini-pool NAT strategy used in high-throughput blood bank settings, as described in recent studies [13] [14].
1. Sample Collection and Preparation
- Collect whole blood from donors in K3EDTA vacuum tubes.
- Centrifuge at 800-1600 × g for 10 minutes at room temperature.
- Carefully aspirate plasma, ensuring no cellular material is transferred.
- Store plasma aliquots at -20°C or lower until testing.
2. Serological Screening (Initial Triage)
- Screen all donor samples for HIV (Ab/Ag), HBsAg, and anti-HCV using FDA-approved/CE-marked immunoassays (e.g., ECLIA on Roche cobas e 601 analyzer).
- Exclusion Criteria: Discard units reactive in initial and confirmatory serological testing.
- Inclusion for NAT: Proceed with serologically non-reactive samples for nucleic acid testing.
3. Mini-Pool Nucleic Acid Testing (MP-NAT)
- Pool Formation: Combine 100 µL of plasma from 6 different seronegative donors to create a mini-pool.
- Nucleic Acid Extraction & Amplification: Use an integrated extraction/amplification system (e.g., cobas s 201 system) with a multiplexed assay (e.g., cobas TaqScreen MPX test v2.0) to detect HIV-1 RNA, HIV-2 RNA, HBV DNA, and HCV RNA simultaneously.
- Run internal controls as specified by the manufacturer with each batch.
4. Resolution Testing
- If a mini-pool tests reactive, deconstruct the pool and test each individual donor sample from that pool separately using the same NAT assay.
- The individual sample(s) that are reactive in the resolution testing are considered confirmed NAT-yield infections.
- Safely discard the corresponding blood products.
Protocol: Multiplex Detection of SARS-CoV-2 and Other Respiratory Pathogens
This protocol is adapted for detecting SARS-CoV-2 and co-circulating respiratory viruses, which is crucial for differential diagnosis [3] [15].
1. Sample Collection (Multiple Options)
- Nasopharyngeal/Nasal Swab: Insert swab into nostril, reaching the posterior nasopharynx. Swab with several rotations and place into viral transport media (VTM).
- Saliva Collection: Have the patient drool directly into a sterile collection tube, collecting at least 1-2 mL. Saliva samples can often be used with minimal processing.
2. Sample Inactivation and Lysis
- For swab samples in VTM or raw saliva, add an equal volume of proteinase K-containing lysis buffer.
- Incubate at 65°C for 15-30 minutes to inactivate the virus and release RNA.
3. Nucleic Acid Extraction
- Use automated magnetic bead-based extraction systems (e.g., on KingFisher or QIAcube platforms) or column-based kits.
- Elution: Elute purified RNA in 50-100 µL of nuclease-free water or the provided elution buffer.
- Critical Step: Include an exogenous internal control (e.g., MS2 phage) added to the lysis buffer to monitor extraction efficiency and PCR inhibition.
4. Reverse Transcription Quantitative PCR (RT-qPCR)
- Reaction Setup: Prepare a master mix containing:
- Reverse transcriptase enzyme
- Hot-start DNA polymerase
- dNTPs
- Primers and probes targeting multiple SARS-CoV-2 genes (e.g., E gene, N gene, RdRP gene). For multiplex panels, include primers/probes for influenza A/B, RSV, etc.
- Probe Chemistry: Use TaqMan probes with distinct fluorophores (e.g., FAM, HEX, Cy5) for each target.
- Thermocycling Conditions (Example):
- Reverse Transcription: 50°C for 10-15 minutes.
- Initial Denaturation: 95°C for 2-5 minutes.
- 45 Cycles of:
- Denaturation: 95°C for 15 seconds.
- Annealing/Extension: 60°C for 30-60 seconds (acquire fluorescence).
- Analysis: Determine the cycle threshold (Ct) value for each target. A sample is considered positive if it produces a specific amplification curve with a Ct value below the validated cutoff.
The Scientist's Toolkit: Key Research Reagent Solutions
Successful implementation of NAT protocols relies on a suite of reliable reagents and instruments. The following table catalogs essential solutions referenced in the featured studies and regulatory documents.
Table 3: Essential Reagents and Platforms for Viral Nucleic Acid Testing
| Research Reagent Solution | Specific Example(s) | Function in NAT Workflow |
|---|---|---|
| Multiplex NAAT Assay | cobas TaqScreen MPX test v2.0 (Roche) [13] | Simultaneously detects and differentiates HIV-1, HIV-2, HBV, and HCV in a single tube. |
| Automated NAAT Platform | cobas s 201 system (Roche) [13], Xpert Xpress (Cepheid) [15] | Integrated system for automated nucleic acid extraction, amplification, and detection. |
| Serology Confirmation Assay | GENSCREEN PLUS HIV Ag-Ab (Bio-Rad), Advanced Quality HBsAg ELISA (InTec) [14] | Immunoassay for initial serological screening of blood donations. |
| Isothermal Amplification Mix | LAMP (Loop-mediated Isothermal Amplification) kits [15] | Amplifies nucleic acids at a constant temperature, enabling simpler device design for point-of-care/home testing. |
| CRISPR-Cas Detection | SHERLOCK, DETECTR [3] [16] | Provides highly specific and sensitive sequence detection, often coupled with isothermal amplification. |
| Sample Collection Kit | Home Collection Kits (e.g., SalivaDirect DTC Kit) [15] | Enables stable self-collection and transport of patient samples for laboratory testing. |
| Internal Control | Exogenous Non-infectious RNA (e.g., MS2 phage) | Added to each sample during lysis to monitor nucleic acid extraction efficiency and rule out PCR inhibition. |
Discussion and Technical Notes
The data and protocols presented herein underscore the pivotal role of NAT in modern virology. The quantitative findings from Pakistan and Mozambique reveal a residual risk of transfusion-transmitted infections that can only be mitigated by the implementation of NAT, as it reliably shortens the diagnostic window period [13] [14]. For respiratory pathogens, the COVID-19 pandemic catalyzed the development of diverse platforms, from lab-based RT-PCR to point-of-care and even home-based isothermal tests (e.g., LAMP), greatly expanding testing accessibility [3] [15].
A key consideration for any NAT assay is primer and probe design. As evidenced by the SARS-CoV-2 pandemic, viruses with high mutation rates can acquire mutations that lead to "target failure" (e.g., S-gene target failure associated with the Omicron variant). Therefore, assays with multiple genetic targets are strongly recommended over single-target tests for novel or rapidly evolving viruses, as they are more likely to maintain diagnostic accuracy against emerging variants [16] [15].
Future directions in the field point toward the integration of isothermal amplification techniques (like RPA and LAMP) with CRISPR-Cas detection systems. These platforms aim to provide sensitivity and specificity rivaling RT-PCR while being faster, equipment-free, and more deployable in low-resource settings, aligning with the WHO's "REASSURED" criteria for ideal diagnostics [3].
Transfusion-transmitted infections (TTIs) represent a major hazard to blood recipients globally, with Hepatitis B virus (HBV), Hepatitis C virus (HCV), and Human immunodeficiency virus (HIV) being among the most significant threats [7]. The World Health Organization (WHO) has established the goal of eliminating TTIs by implementing rigorous screening of blood donations, targeting a zero-risk blood supply by 2030 [7]. While traditional serological testing methods, such as chemiluminescence immunoassay (CLIA), have been foundational in blood screening, they primarily detect the immune response to pathogens rather than the presence of the virus itself [7]. Nucleic Acid Testing (NAT) has emerged as a critical advancement, enabling the direct detection of viral nucleic acids and significantly reducing the diagnostic window period between infection and detectability [7] [17]. This application note details the role of NAT within the broader context of viral nucleic acid testing protocols research, providing a comparative performance analysis, detailed experimental methodologies, and implementation protocols to enhance blood safety for researchers, scientists, and drug development professionals.
Performance Analysis: NAT Versus Serological Testing
Comparative Detection Rates
The superior sensitivity of NAT directly translates into the identification of additional infectious units that serological testing misses, thereby enhancing the safety of the blood supply. These "NAT yield" cases are particularly important as they represent donations from donors in the early, pre-seroconversion stage of infection. A large-scale retrospective analysis of 87,620 blood specimens from voluntary donors compared the detection rates of CLIA and NAT [7].
Table 1: Comparative Detection Rates of CLIA and NAT in Blood Donor Screening
| Virus | Total Reactive by CLIA | Total Reactive by NAT | True Positives | False Positives (CLIA) | False Negatives (CLIA) | NAT Yield (Additional Cases Detected) |
|---|---|---|---|---|---|---|
| HBV | 676 | 621 | 589 | 87 | 32 | 32 |
| HCV | 1,477 | 1,328 | 1,305 | 172 | 23 | 23 |
| HIV | 22 | 19 | 19 | 3 | 0 | 0 |
| Total | 2,175 | 1,968 | 1,913 | 262 | 55 | 55 |
Data adapted from a retrospective analysis of 87,620 specimens [7].
The data demonstrates that NAT detected 55 infectious donations (32 for HBV and 23 for HCV) that were missed by CLIA screening. These represent the critical "window period" infections where the donor is infectious but has not yet developed detectable antibodies or antigens. Furthermore, CLIA exhibited a substantial number of false-positive results (262 across the three viruses), which can lead to unnecessary disposal of safe blood units and deferral of healthy donors [7].
Another study involving 30,335 blood donations provided further evidence of NAT's superior sensitivity and specificity [17].
Table 2: Diagnostic Accuracy of NAT and CLIA for TTI Screening
| Virus | Metric | NAT | CLIA |
|---|---|---|---|
| HBV | Sensitivity | 98.50% | 79.09% |
| Specificity | 98.00% | ~72.9%* | |
| HCV | Sensitivity | 97.50% | 64.20% |
| Specificity | 98.00% | ~83.5%* | |
| HIV | Sensitivity | 98.00% | 94.44% |
| Specificity | 98.50% | ~94.3%* |
* Calculated based on false positive rates reported in [17].
Statistical Agreement and Clinical Impact
Despite the differences in sensitivity, studies show a high statistical agreement between NAT and CLIA. The agreement, measured using the kappa statistic, was nearly perfect: 0.929 for HCV, 0.907 for HBV, and 0.900 for HIV [7]. This indicates that while NAT is more sensitive, the two tests are generally consistent in their findings.
The implementation of NAT, therefore, has a direct and measurable impact on blood transfusion safety. By identifying window-period and occult infections, NAT significantly reduces the residual risk of TTIs. The cost-effectiveness of NAT is particularly pronounced for HBV and HCV, though it can be less so for HIV due to the already high sensitivity of CLIA for this virus [17].
Experimental Protocol for NAT in Blood Screening
This protocol provides a detailed methodology for screening plasma from blood donations for HBV, HCV, and HIV using a multiplexed NAT approach on a high-throughput automated system [7].
Principle
The protocol is based on the automated extraction, purification, and reverse transcription of viral nucleic acids (RNA and DNA) from individual donor plasma samples, followed by simultaneous amplification and detection of conserved target sequences for HIV, HCV, and HBV using multiplex real-time polymerase chain reaction (PCR) technology. The process includes an internal control to monitor for potential inhibition [7].
Specimen Collection and Preparation
- Collection: Collect whole blood from voluntary non-remunerated blood donors using sterile collection bags containing an appropriate anticoagulant (e.g., CPDA-1).
- Processing: Within 6 hours of collection, centrifuge the whole blood at a minimum of 5,000 × g for 5 minutes at room temperature to separate plasma.
- Aliquoting: Aseptically transfer at least 2 mL of plasma into a labelled, sterile, nuclease-free primary tube.
- Storage: If testing is not immediate, store plasma specimens at 2–8°C for up to 72 hours. For longer storage, freeze at -20°C or below and avoid repeated freeze-thaw cycles.
Materials and Reagents
Table 3: Essential Research Reagent Solutions for NAT Screening
| Item | Function | Specification / Example |
|---|---|---|
| Plasma Specimen | Source of viral nucleic acid for detection. | Human EDTA or CPDA plasma, visually clear and non-lipemic. |
| Nucleic Acid Test Kit | Multiplex assay for simultaneous pathogen detection. | Qualitative multiplex test (e.g., cobas MPX test) for HIV-1 RNA, HCV RNA, and HBV DNA. |
| Internal Control | Monitors the entire process from extraction to amplification for inhibition. | Non-infectious, exogenous RNA/DNA sequence provided in the assay kit. |
| Lysis Buffer | Inactivates virus and releases nucleic acids. | Contains chaotropic salts and detergents. |
| Wash Buffers | Remove impurities and inhibitors during nucleic acid purification. | Ethanol-based buffers of varying ionic strength. |
| Elution Buffer | Final resuspension of purified nucleic acids. | Low-salt buffer or nuclease-free water. |
| Enzyme Master Mix | Amplifies and detects target sequences. | Contains reverse transcriptase, Taq polymerase, primers, and probes for multiplex PCR. |
| Automated Analyzer | Integrates and automates all steps of the NAT process. | System with sample supply, transfer, processing, and analytical modules (e.g., Cobas 6800/8800 systems). |
Procedure
The following workflow outlines the key steps in the NAT screening process, from sample preparation to result interpretation.
- System Initialization: Power on the automated nucleic acid testing system (e.g., Cobas 6800/8800). Initialize the system using manufacturer-defined procedures, which include priming the fluidic system and performing start-up checks.
- Reagent and Sample Loading: Load the pre-packaged reagent cassettes (containing lysis, wash, and elution buffers) and the enzyme master mix onto their designated positions in the analyzer. Place primary sample tubes in the sample racks and load them into the system.
- Automated Nucleic Acid Extraction and Purification:
- The system automatically aliquots the patient plasma and combines it with the lysis buffer, which inactivates the virus and releases nucleic acids.
- Nucleic acids are bound to a solid-phase magnetic particle in the presence of a chaotropic salt.
- Magnetic separation and multiple wash steps are performed to remove proteins, salts, and other potential inhibitors.
- Purified nucleic acids are eluted into a small volume of elution buffer.
- Amplification and Detection:
- The eluate containing the purified nucleic acids is automatically transferred to a new reaction vessel and mixed with the enzyme master mix.
- The reaction plate is transferred to the thermocycler module.
- The multiplex real-time PCR protocol is executed:
- Reverse Transcription (if applicable): 50°C for 15 minutes (for RNA viruses HIV and HCV).
- PCR Activation: 95°C for 2 minutes.
- Amplification (45-50 cycles): Denaturation at 95°C for 15 seconds, then combined annealing/extension at 60°C for 30 seconds with fluorescent signal acquisition.
- Result Analysis and Interpretation: The system's software analyzes the amplification curves for each target (HBV, HCV, HIV) and the internal control. Results are automatically assigned as follows:
- Non-Reactive: No amplification curve is detected for any viral target, and the internal control amplifies as expected.
- Reactive: A specific amplification curve is detected for one or more viral targets.
- Invalid: The internal control fails to amplify, indicating potential inhibition or a processing error. The specimen must be retested.
Quality Control and Troubleshooting
- Quality Control: The internal control in each specimen is the primary quality control measure. Additionally, external positive and negative controls should be run with each batch of samples as per the laboratory's quality management system [7].
- Troubleshooting Invalid Results: For invalid results due to internal control failure, repeat the test with the original specimen. If the failure persists, re-collect the sample if possible [18].
- Resolving Discrepant Results: In cases where NAT is reactive but CLIA is non-reactive (false-negative CLIA), the result is interpreted as a true NAT yield, indicating an early infection. When CLIA is reactive but NAT is non-reactive (false-positive CLIA), it may indicate a prior, cleared infection, the presence of cross-reacting antibodies, or, in the case of HBV, a transient positive HBsAg after vaccination [7]. Supplementary tests (e.g., neutralization assays, alternative NAT assays) are recommended for confirmation.
Nucleic Acid Testing represents a fundamental advancement in the paradigm of blood safety, moving beyond serological markers to direct, sequence-specific detection of viral pathogens [7]. The quantitative data and detailed protocol presented herein underscore NAT's critical role in minimizing the residual risk of TTIs by closing the diagnostic window period and identifying occult infections. Its high sensitivity and specificity, combined with the high-throughput capabilities of modern automated systems, make it an indispensable tool for blood transfusion centers. The adoption and continuous refinement of NAT protocols, as part of a layered screening approach that includes careful donor selection and serological testing, are essential to achieving the global goal of a zero-risk blood supply.
Methodologies and Workflow Implementation in NAT Systems
Viral nucleic acid testing (NAT) is a cornerstone of modern molecular diagnostics, virology research, and therapeutic development. The selection of an appropriate amplification technique is critical for achieving the desired sensitivity, specificity, speed, and practicality for a given application. This application note provides a detailed comparative analysis of four core amplification technologies: Quantitative Reverse Transcription PCR (qRT-PCR), Loop-Mediated Isothermal Amplification (LAMP), Recombinase Polymerase Amplification (RPA), and Transcription-Mediated Amplification (TMA). It is structured within a broader research context on viral NAT protocols, providing researchers and drug development professionals with consolidated data, standardized protocols, and visual workflows to inform experimental design and implementation.
Technology Comparison and Quantitative Data
The following table summarizes the core characteristics and performance metrics of the four featured amplification technologies, providing a basis for initial technology selection.
Table 1: Comparative Analysis of Viral Nucleic Acid Amplification Technologies
| Feature | qRT-PCR | LAMP | RPA | TMA |
|---|---|---|---|---|
| Amplification Principle | PCR-based thermal cycling | Isothermal strand displacement | Isothermal recombinase-driven primer insertion | Isothermal transcription-based amplification |
| Primary Target | RNA (via cDNA synthesis) | DNA/RNA (with reverse transcriptase) | DNA/RNA (with reverse transcriptase) | RNA |
| Typical Reaction Temperature | 55-95°C (cycling) | 60-65°C | 37-42°C | 41-42°C [19] |
| Typical Assay Time | 1.5 - 2 hours | 15 - 60 minutes [20] [19] | 10 - 20 minutes [21] | < 2 hours [19] |
| Key Enzymes | Reverse Transcriptase, Thermostable DNA Polymerase | Bst DNA Polymerase (strand-displacing) | Recombinase, Single-Stranded DNA-Binding Protein, Strand-Displacing Polymerase | Reverse Transcriptase, RNA Polymerase [19] |
| Primer System | 2 primers | 4-6 primers [19] | 2 primers | 2 primers and 1 probe [19] |
| Detection Methods | Fluorescent probes (e.g., TaqMan) or intercalating dyes | Turbidity, colorimetry, fluorescent dyes [19] | Fluorescent probes or intercalating dyes | Turbidity, colorimetry, fluorescent probes [19] |
| Relative Sensitivity | High (detects down to a few copies) | High [19] | High (single-copy detection) [19] | Very High [19] |
| Instrument Requirement | Thermal Cycler with fluorescence detection | Simple Heater/Block | Simple Heater/Block | Automated or simple heater system |
| Key Advantage | Quantitative, gold standard, highly sensitive | Simple instrumentation, rapid, visual detection | Rapid, low-temperature operation | High sensitivity, specific for RNA |
| Key Limitation | Requires expensive thermal cycler | Primer design complexity, multiplexing challenges | Cost of proprietary enzymes, limited multiplexing | Commercial kit dependency |
Detailed Experimental Protocols
Protocol 1: One-Step qRT-PCR for Viral RNA Detection
This protocol is adapted for the sensitive and quantitative detection of viral RNA, such as SARS-CoV-2, using a one-step master mix [22].
Research Reagent Solutions:
- One-Step qRT-PCR Master Mix: Contains reverse transcriptase, hot-start DNA polymerase, dNTPs, and optimized buffer.
- Virus-Specific Primers and Probe: Designed against a conserved region of the viral genome (e.g., SARS-CoV-2 N gene). The probe is dual-labeled with a 5' fluorophore (e.g., FAM) and a 3' quencher.
- Nuclease-Free Water: To adjust reaction volume.
- RNA Template: Purified viral RNA or extracted nucleic acid from clinical samples (e.g., nasopharyngeal swabs).
Methodology:
- Reaction Setup: On ice, prepare a 20 µL reaction mix containing:
- 10 µL of 2X One-Step qRT-PCR Master Mix
- 1 µL of 20X Primer/Probe Mix (final concentration: 500 nM primers, 250 nM probe)
- Up to 5 µL of RNA template
- Nuclease-free water to 20 µL
- Thermal Cycling: Load the plate into a real-time PCR instrument and run the following program:
- Reverse Transcription: 50°C for 10-15 minutes.
- Enzyme Activation: 95°C for 2 minutes.
- Amplification (40-45 cycles):
- Denaturation: 95°C for 15 seconds.
- Annealing/Extension: 55-60°C for 30-60 seconds (acquire fluorescence).
- Data Analysis: Determine the Cycle Threshold (Ct) value for each sample. Quantify the viral load by comparing Ct values to a standard curve of known copy numbers.
Protocol 2: Reverse Transcriptase-LAMP (RT-LAMP) for Point-of-Care Viral Detection
This protocol describes a colorimetric RT-LAMP assay suitable for rapid, visual detection of viruses like SARS-CoV-2 in resource-limited settings [20].
Research Reagent Solutions:
- Bst DNA Polymerase (or similar strand-displacing polymerase): The core enzyme for isothermal amplification.
- Reverse Transcriptase: For cDNA synthesis from viral RNA.
- LAMP Primer Set: A set of 4-6 primers (F3, B3, FIP, BIP, Loop F, Loop B) targeting the viral genome.
- dNTPs: Deoxyribonucleotide triphosphates.
- WarmStart Colorimetric LAMP Master Mix: Contains a phenol red pH indicator.
- RNA Template: Purified or crude lysate.
Methodology:
- Reaction Setup: Prepare a 25 µL reaction mix containing:
- 12.5 µL of 2X WarmStart Colorimetric LAMP Master Mix
- 1.5 µL of 10X LAMP Primer Mix
- 1 µL of Reverse Transcriptase (if not included in the master mix)
- 2-5 µL of RNA template
- Nuclease-free water to 25 µL
- Incubation: Incubate the reaction tube in a heat block or water bath at a constant 60-65°C for 15-30 minutes.
- Detection: Visually observe the color change.
- Positive: Yellow (acidic pH due to pyrophosphate production).
- Negative: Pink/Magenta (basic pH).
Protocol 3: RPA for Ultra-Rapid Viral Nucleic Acid Amplification
RPA is renowned for its speed and low operating temperature, making it ideal for field-deployable diagnostics [21].
Research Reagent Solutions:
- RPA Basic Kit: Contains recombinase enzymes, single-stranded DNA-binding proteins, strand-displacing polymerase, and reaction buffer.
- Virus-Specific Primers: Designed according to RPA guidelines.
- Magnesium Acetate (MgOAc): A critical cofactor that must be added to initiate the reaction.
- Fluorescent Probe (optional, for real-time detection): A exo probe (e.g., with FAM/THF/Black Hole Quencher).
Methodology:
- Rehydration: Rehydrate the RPA pellet with 29.5 µL of rehydration buffer and the provided primer mix.
- Template Addition: Add 2 µL of extracted nucleic acid template.
- Initiation: Pipette 2.5 µL of 280 mM Magnesium Acetate (MgOAc) into the tube lid. Briefly centrifuge to start the reaction.
- Incubation and Detection: Incubate the tube at 37-42°C for 10-20 minutes. For real-time detection, place the tube in a portable fluorescent reader pre-warmed to 39°C and monitor the fluorescence signal.
Protocol 4: TMA for Highly Sensitive Viral RNA Detection
TMA is an isothermal, transcription-based method known for its exceptional sensitivity in detecting RNA viruses like HIV and HCV [19].
Research Reagent Solutions:
- TMA Master Mix: Typically includes reverse transcriptase and T7 RNA polymerase.
- Target-Specific Primers: One primer contains a T7 RNA polymerase promoter sequence.
- Detection Probes: Chemiluminescent or fluorescently labeled DNA probes for hybridizing to the amplified RNA amplicons.
Methodology:
- Reaction Setup: Combine the TMA master mix, primers, and the target RNA sample in a single tube.
- Incubation: Incubate the reaction at 41-42°C for 30-60 minutes.
- Amplification Process:
- The reverse transcriptase uses the primer with the T7 promoter to create a DNA copy of the RNA target, forming an RNA:DNA duplex.
- The RNA is degraded, and the second primer binds to the cDNA, allowing the reverse transcriptase to synthesize a double-stranded DNA molecule with a functional T7 promoter.
- T7 RNA polymerase then transcribes hundreds to thousands of RNA copies from this DNA template.
- Each of these RNA amplicons is recycled back into the process, leading to exponential, isothermal amplification.
- Detection: The amplified RNA products are typically detected using a hybridization protection assay (HPA) with chemiluminescent probes or in real-time with fluorescent probes.
Workflow and Technology Selection Visualization
The following diagram illustrates the logical decision-making process for selecting an appropriate amplification technology based on key experimental requirements.
Essential Research Reagent Solutions
Successful implementation of viral NAT protocols relies on a core set of reagents. The following table details these essential components and their functions.
Table 2: Key Research Reagent Solutions for Viral Nucleic Acid Amplification
| Reagent Category | Specific Examples | Critical Function in the Reaction |
|---|---|---|
| Polymerases | Bst DNA Polymerase (LAMP) [23], Recombinase/Polymerase Mix (RPA), T7 RNA Polymerase (TMA) [19] | Enzymes that catalyze the synthesis of new nucleic acid strands. The specific type (strand-displacing, recombinase-enabled, etc.) defines the technology. |
| Primers & Probes | TaqMan Probes (qRT-PCR), LAMP Primer Sets (F3, B3, FIP, BIP) [19], RPA exo Probes | Provide sequence specificity for targeting the viral genome. Probes enable real-time, specific detection of the amplicon. |
| Nucleotides & Cofactors | dNTPs (all methods), NTPs (TMA), Magnesium Acetate (RPA) [21] | dNTPs/NTPs are the building blocks for new DNA/RNA strands. Mg²⁺ is an essential cofactor for polymerase activity. |
| Buffer Systems | Isothermal Amplification Buffer, PCR Buffer | Provide the optimal chemical environment (pH, ionic strength) for enzyme activity and reaction specificity. |
| Detection Chemistries | SYBR Green, Phenol Red (colorimetric LAMP) [21], Chemiluminescent Probes (TMA) | Enable visualization and quantification of the amplification product through fluorescence, color change, or light emission. |
| Sample Preparation Kits | RNA Extraction Kits, Viral Lysis Buffers | Isolate and purify nucleic acids from complex clinical samples (e.g., swabs, blood), removing inhibitors. |
The choice of an amplification technology is a fundamental decision in viral NAT protocol design. qRT-PCR remains the gold standard for quantitative analysis, while isothermal methods like LAMP, RPA, and TMA offer compelling advantages in speed, simplicity, and portability for qualitative detection. LAMP is excellent for robust, visual POC tests, RPA offers unparalleled speed and low-temperature operation, and TMA provides exceptional sensitivity for RNA targets. The optimal technology depends on the specific requirements of the research or diagnostic application, including the need for quantification, available infrastructure, assay time, and the required sensitivity. Understanding the principles, protocols, and reagents outlined in this document will empower researchers and drug development professionals to select and implement the most effective viral NAT strategy.
Within the framework of viral Nucleic Acid Testing (NAT) protocols, the efficiency of sample processing and nucleic acid extraction is a critical determinant of downstream assay success. This initial phase is paramount for isolating high-quality viral DNA and RNA from complex biological matrices, free from inhibitors that can compromise enzymatic reactions in techniques like quantitative PCR (qPCR) and Next-Generation Sequencing (NGS) [24] [25]. The selection of an appropriate extraction method significantly influences the sensitivity, accuracy, and reliability of viral detection and quantification, especially when dealing with low-abundance pathogens or challenging sample types such as clinical specimens and vaccine biologicals [25] [26]. This application note provides a structured evaluation of extraction efficiency and detailed protocols to support robust viral NAT in research and drug development.
Comparative Efficiency of Nucleic Acid Extraction Methods
The recovery efficiency of viral nucleic acids varies considerably among different extraction technologies and commercial kits. Key differentiators include the use of proteolytic enzymes, the inclusion of carrier nucleic acids, the core binding technology (e.g., silica columns vs. magnetic beads), and the specific composition of lysis and washing buffers [24] [26].
Table 1: Comparative Performance of Viral Nucleic Acid Extraction Methods
| Extraction Method / Kit | Target Nucleic Acid | Key Technology / Features | Reported Efficiency / Performance | Protocol Duration (Minutes) | Sample Types |
|---|---|---|---|---|---|
| Invitrogen PureLink Virus RNA/DNA Kit [25] | Total NA (ssRNA, dsRNA, dsDNA) | Silica membrane column | Reproducibly higher or equal yield for a panel of viruses (EBV, Reo3, FeLV, RSV) compared to other methods [25] | ~45 [27] | Cell-free plasma, serum, cerebrospinal fluid [27] |
| QIAamp Blood DNA Kit [24] | Viral DNA | Silica column, proteolytic enzyme, carrier | High HBV DNA recovery efficiency, comparable to High Pure viral nucleic acid kit [24] | Not specified | Serum, plasma |
| High Pure Viral Nucleic Acid Kit [24] | Viral DNA/RNA | Silica column, enzyme digestion, chaotropic salts | One of the most efficient for HBV DNA recovery [24] | Not specified | Serum, plasma |
| Five-Minute Extraction (FME) Method [26] | Viral RNA/DNA | Magnetic beads, GTC lysis, glycerin/ethanol wash | Equivalent detection rate to standard magnetic bead method for IAV; high RNA concentration/purity [26] | 5 [26] | Respiratory samples (e.g., nasopharyngeal swabs) [26] |
| Magnetic Bead-Based Kits (e.g., MagMAX) [27] | Viral RNA/DNA | Paramagnetic beads, chaotropic salts | High and consistent RNA yields; easily automatable; suitable for NGS [27] | 25-30 (Manual) [26] | Swabs, saliva, stool, urine, plasma, serum [27] |
| Phenol-Chloroform (TRIzol) [26] | Total RNA | Organic solvent precipitation | Lower recovery for FeLV (ssRNA) and EBV (dsDNA); risk of organic matter contamination [25] [26] | >70 [26] | Tissues, cells [26] |
A seminal study evaluating five extraction kits for viral DNA from serum highlighted that protocols incorporating a proteolytic enzyme digestion step in addition to chaotropic solutions demonstrated superior recovery of Hepatitis B Virus (HBV) DNA compared to those relying on chemical disruption alone [24]. Furthermore, kits supplied with carrier nucleic acid and guaranteed to be RNase-free were noted to have the widest application in a routine microbiology laboratory [24]. More recent research underscores that methods using bind-elute technologies (silica membranes or magnetic beads) are generally adept at extracting all nucleic acid types, while precipitation techniques often show poorer recovery, particularly for single-stranded RNA viruses [25].
Detailed Experimental Protocols for Efficiency Evaluation
Protocol 1: Standardized Evaluation of Extraction Kits Using qPCR
This protocol outlines a method to compare the relative efficiencies of different nucleic acid extraction kits for recovering viral DNA and RNA from serum samples, using quantitative PCR (qPCR) on a platform like the LightCycler [24].
- 1. Sample Preparation: Begin with well-characterized sample pools. For DNA evaluation, use a serum pool with a known concentration of viral DNA (e.g., HBV DNA at 25 million genome equivalents/mL). For RNA evaluation, use a serum pool with a known concentration of viral RNA (e.g., HCV RNA at 2.5 million genome equivalents/mL). Confirm concentrations using a reference method prior to the experiment [24].
- 2. Nucleic Acid Extraction: Process aliquots of the sample pools in parallel using each extraction kit under evaluation. Strictly follow the manufacturers' instructions. To standardize comparisons, use a consistent serum volume to elution buffer volume ratio (e.g., eluting in half the original serum volume). Do not utilize optional steps like double elution [24].
- 3. Quantitative PCR (qPCR):
- HBV DNA PCR: Use a reaction mix containing SYBR Green I, primers targeting a conserved region (e.g., the core open reading frame), and a suitable Taq polymerase. Use a thermal cycling profile with an initial denaturation at 95°C for 5 seconds, followed by 33 cycles of 96°C for 0s, 50°C for 5s, 72°C for 15s, and a data acquisition step at 81°C for 5s [24].
- HCV RNA RT-PCR: Use a one-step RT-PCR kit. The thermal profile should include reverse transcription at 55°C for 10 minutes, initial denaturation at 95°C for 5 seconds, followed by 40 cycles of 96°C for 0s, 55°C for 5s, 72°C for 15s, and data acquisition at 88°C for 5s [24].
- 4. Data Analysis: Determine the cycle threshold (Ct) or "noise band crossing point" for each replicate. Compare the mean Ct values between kits; a later Ct indicates lower extraction efficiency. For absolute comparison, use the nucleic acid extracted by the most efficient kit to create a log10 dilution series of quantification standards. Use this standard curve to determine the relative concentration of viral nucleic acid recovered by the other kits [24].
Protocol 2: Dual-Armed Extraction for Comprehensive Viral Recovery
For broad-spectrum adventitious agent detection using HTS, a dual-armed extraction strategy is recommended to efficiently recover all viral nucleic acid types (ssRNA, dsRNA, dsDNA) from a complex cell substrate matrix [25].
- 1. Sample Lysis and Processing: Spike the model virus panel (e.g., EBV, Reo3, FeLV, RSV) into the biological matrix, such as a HeLa cell culture. Divide the lysate for parallel processing in two arms.
- 2. Arm A - Total Nucleic Acid Extraction: Extract total nucleic acid using a kit demonstrated to have high and reproducible recovery for all virus types, such as the Invitrogen PureLink Virus RNA/DNA Kit. This arm ensures recovery of the full spectrum of nucleic acids [25].
- 3. Arm B - Enriched Double-Stranded Nucleic Acid Extraction: Extract DNA using a kit like the Wako DNA Extractor Kit, which includes an RNase A digestion step during the initial Proteinase K digestion. This step degrades single-stranded RNA, thereby enriching for double-stranded nucleic acids (dsDNA and dsRNA) and significantly improving the recovery of viruses like mammalian orthoreovirus (Reo3) [25].
- 4. Nucleic Acid Combination and Downstream Processing: Combine the eluates from Arm A and Arm B. Convert all RNA to double-stranded DNA using a first- and second-strand synthesis protocol. This dsDNA product is then suitable for library preparation and HTS analysis. Note that Whole-Genome Amplification (WGA) should be avoided if unbiased representation is critical, as it exhibits a strong bias toward amplifying double-stranded DNA, including host cellular DNA [25].
The following workflow diagram illustrates this dual-arm strategy:
Data Analysis and Presentation for Efficiency Studies
Effective data presentation is crucial for interpreting the results of extraction efficiency studies. Quantitative data should be summarized using clearly structured tables and appropriate visualizations to highlight key findings [28].
Table 2: Essential Research Reagent Solutions for Nucleic Acid Extraction
| Reagent / Solution | Function / Purpose | Example Composition / Notes |
|---|---|---|
| Lysis Solution | Disrupts viral envelopes and cells, inactivates nucleases, and releases nucleic acids. | Often contains chaotropic salts (e.g., Guanidine Thiocyanate - GTC), detergents (e.g., Sarkosyl), and reducing agents (e.g., DTT) [26]. |
| Proteolytic Enzyme | Digests proteinaceous material and aids in the disruption of viral capsids. | Proteinase K. Its inclusion significantly improves viral DNA recovery from serum [24]. |
| Binding Matrix | Selectively binds nucleic acids in high-salt conditions for separation from contaminants. | Silica (in columns or membranes) or superparamagnetic beads [24] [27]. |
| Wash Buffer | Removes proteins, salts, and other impurities from the bound nucleic acid. | Typically contains ethanol and a buffer. A novel wash solution of 50% glycerin and 50% ethanol has been validated for rapid, efficient washing [26]. |
| Elution Buffer | Releases purified nucleic acids from the binding matrix in a low-salt solution. | Low-ionic-strength buffer such as Tris-EDTA (TE) or nuclease-free water [26]. |
| Carrier Nucleic Acid | Improves the recovery efficiency of low-concentration viral nucleic acids by providing bulk for precipitation or binding. | Often included in kits designed for high-sensitivity applications [24]. |
| Nuclease Inhibitors | Protect labile RNA from degradation by ubiquitous RNases. | Included in lysis buffers and elution solutions to maintain RNA integrity [27]. |
When presenting results, bar graphs are highly effective for comparing mean values (e.g., Ct values or relative concentrations) between different extraction kits or methods. For data that shows the relationship between two continuous variables, such as input viral load and output nucleic acid concentration, scatter plots with regression lines are recommended [29] [28]. All figures and tables should be self-explanatory, with clear titles and defined footnotes for any abbreviations or statistical annotations [28].
The rigorous evaluation of nucleic acid extraction efficiency is a foundational step in developing and validating robust viral NAT protocols. The data and protocols detailed herein demonstrate that method selection profoundly impacts yield, purity, and the subsequent detection of viral targets. Key considerations include the use of enzymatic digestion for enhanced recovery, the application of dual-arm strategies for unbiased HTS, and the adoption of novel reagents that reduce processing time without compromising quality. By applying these standardized evaluation protocols and data presentation guidelines, researchers and drug development professionals can significantly optimize their sample processing pipelines to ensure the highest levels of sensitivity and reliability in viral nucleic acid testing.
Severe Acute Respiratory Syndrome Coronavirus 2 (SARS-CoV-2), the causative agent of the COVID-19 pandemic, possesses a positive-sense single-stranded RNA genome of approximately 26–32 kilobases, representing the largest known RNA virus genome [30] [31] [32]. The genomic organization follows a characteristic pattern shared with other beta-coronaviruses, featuring overlapping open reading frames (ORFs) that encode both structural and non-structural proteins essential for viral replication, assembly, and pathogenesis [33] [30]. Understanding this architectural blueprint is fundamental to designing effective nucleic acid testing (NAT) protocols that target diagnostically significant regions.
The SARS-CoV-2 genome can be functionally divided into two main regions. The 5'-terminal two-thirds encompasses ORF1a and ORF1ab, which are translated into two large polyproteins (pp1a and pp1ab) that undergo proteolytic processing to yield 16 non-structural proteins (NSPs 1-16) [34] [31] [32]. These NSPs assemble into the replication-transcription complex (RTC) responsible for viral RNA synthesis and processing [35]. The remaining 3'-terminal one-third of the genome encodes four essential structural proteins—spike (S), envelope (E), membrane (M), and nucleocapsid (N)—along with several accessory proteins interspersed between these structural genes (ORF3a, ORF6, ORF7a, ORF7b, ORF8, and ORF10) [33] [30] [31]. This sophisticated genomic arrangement provides multiple targets for molecular diagnostic assays, each with distinct advantages for clinical detection and research applications.
Structural and Non-Structural Gene Targets for NAT
The ORF1ab Replicase Complex: A Primer for Early Detection
ORF1ab represents the largest ORF in the SARS-CoV-2 genome, occupying approximately two-thirds of the viral RNA and encoding a replicase polyprotein of 7,096 amino acids [34]. This polyprotein undergoes autocleavage by viral proteases (NSP3 [PLpro] and NSP5 [3CLpro/Mpro]) to generate 16 non-structural proteins that form the RTC [34] [36] [35]. Targeting ORF1ab in NAT assays offers distinct advantages for early infection detection. As the first viral protein complex to be expressed upon host cell entry, ORF1ab provides an early indicator of active viral replication [34]. Furthermore, bioinformatic analyses reveal that ORF1ab contains evolutionarily stable regions with zero Shannon's entropy, indicating high sequence conservation across variants [34]. This conservation is crucial for maintaining assay efficacy against emerging variants with mutations in structural protein genes.
The functional importance of individual NSPs derived from ORF1ab underscores their value as detection targets. NSP12 (RNA-dependent RNA polymerase, RdRp) serves as the catalytic core of the RTC and is highly conserved among coronaviruses [30] [35]. NSP13 functions as a helicase involved in RNA unwinding, while NSP14 possesses exoribonuclease activity critical for proofreading during replication [35]. NSP10 acts as a crucial cofactor for both NSP14 and NSP16, the latter mediating RNA cap formation [35]. Studies utilizing SARS-CoV-2 replicon systems have demonstrated that deletions of most NSPs (except NSP16) drastically impair viral replication, highlighting their indispensable roles in the viral life cycle [35]. These essential NSPs within ORF1ab therefore represent prime targets for diagnostic detection and therapeutic intervention.
Structural Genes: S, N, E, and M Proteins
The structural proteins encoded in the 3' end of the SARS-CoV-2 genome serve vital functions in viral assembly and host cell entry, making them valuable targets for NAT assays. The spike (S) protein mediates viral attachment to host angiotensin-converting enzyme 2 (ACE2) receptors through its receptor-binding domain (RBD) and facilitates membrane fusion via its S2 subunit [33] [31] [32]. While the S protein shows higher mutation rates, particularly in the RBD, it remains a critical target for assessing infectivity and immune evasion [34] [31]. The nucleocapsid (N) protein packages the viral RNA into a helical ribonucleoprotein complex and is abundantly expressed during infection [30] [32]. Its high conservation and expression level make it an excellent target for sensitive detection. The envelope (E) protein forms a viroporin ion channel essential for virion assembly and release, while the membrane (M) protein promotes viral assembly by stabilizing the N protein-RNA complex [36] [30]. These structural genes offer complementary targets for multiplex NAT assays, enabling robust detection through parallel amplification.
Table 1: SARS-CoV-2 Gene Targets for Nucleic Acid Testing
| Gene Target | Genomic Location | Protein Size | Key Functions | Advantages for NAT |
|---|---|---|---|---|
| ORF1ab | 5'-terminal two-thirds | 7,096 amino acids (polyprotein) | Viral replication and transcription | Early detection, high conservation, first protein expressed |
| S (Spike) | 3'-terminal one-third | ~1,200 amino acids | Host cell receptor binding, membrane fusion | Critical for infectivity, good for variant tracking |
| N (Nucleocapsid) | 3'-terminal one-third | 419 amino acids | RNA packaging, viral assembly | Highly expressed, abundant RNA, conserved regions |
| E (Envelope) | 3'-terminal one-third | 75 amino acids | Virion assembly, viroporin activity | Essential function, conserved sequence |
| M (Membrane) | 3'-terminal one-third | 222 amino acids | Viral budding, assembly scaffolding | Conserved, structural integrity role |
Comparative Detection Rates of Viral Targets
Clinical studies evaluating SARS-CoV-2 detection methods have demonstrated varying performance characteristics across different gene targets. A comprehensive analysis of 87,620 specimens from voluntary blood donors compared nucleic acid testing (NAT) with chemiluminescence immunoassay (CLIA) for viral detection [7]. The NAT approach demonstrated superior specificity with lower false-positive rates across all targets. For HCV detection, NAT identified 1.52% reactive samples compared to 1.69% by CLIA, with NAT revealing 23 false-negative cases that were CLIA-negative [7]. Similarly, for HBV, NAT detected 0.71% reactive specimens versus 0.77% by CLIA, identifying 32 false-negative cases that were CLIA-negative [7]. HIV detection showed the highest concordance, with NAT identifying 0.02% reactive samples compared to 0.03% by CLIA [7]. These findings underscore the critical importance of target selection in assay design, with conserved regions of ORF1ab, N, and E genes providing optimal sensitivity and specificity.
Table 2: Performance Comparison of NAT Versus Serological Testing
| Virus | Reactive by CLIA | Reactive by NAT | False Positives (CLIA+/NAT-) | False Negatives (CLIA-/NAT+) | NAT Accuracy |
|---|---|---|---|---|---|
| HCV | 1.69% (1,477/87,620) | 1.52% (1,328/87,620) | 172 | 23 | 99.78% |
| HBV | 0.77% (676/87,620) | 0.71% (621/87,620) | 87 | 32 | 99.86% |
| HIV | 0.03% (22/87,620) | 0.02% (19/87,620) | 3 | 0 | 100% |
SARS-CoV-2 Nucleic Acid Testing Protocol
Specimen Collection and RNA Extraction
Proper specimen collection and RNA extraction represent critical initial steps in SARS-CoV-2 NAT protocols. Nasopharyngeal swabs collected in viral transport media remain the gold standard for respiratory specimen collection, though saliva and lower respiratory samples may also be utilized in specific clinical scenarios. RNA extraction should be performed using commercial silica-membrane-based kits that ensure high nucleic acid purity and recovery. The recommended workflow includes: (1) specimen vortexing with 500 μL of viral transport media; (2) protease K treatment at 56°C for 15 minutes; (3) addition of binding buffer and ethanol; (4) transfer to spin columns with centrifugation at 12,000 × g; (5) two wash steps with wash buffers; and (6) elution in 50-60 μL of RNase-free water. For high-throughput applications, automated extraction systems such as the MagMAX Viral/Pathogen Nucleic Acid Isolation Kit can process 96 samples within 60 minutes. Extracted RNA should be stored at -80°C if not used immediately to prevent degradation.
Reverse Transcription and Quantitative PCR Amplification
Reverse transcription quantitative PCR (RT-qPCR) constitutes the core detection methodology for SARS-CoV-2 NAT. The following protocol utilizes a one-step RT-qPCR approach that combines reverse transcription and amplification in a single reaction, reducing hands-on time and potential contamination. Prepare a master mix containing: 5 μL of 4× TaqPath RT-qPCR buffer, 0.5 μL of 20× enzyme mix (reverse transcriptase and hot-start DNA polymerase), 1 μL of primer-probe mix (each primer at 10 μM and probe at 5 μM), 8.5 μL of nuclease-free water, and 5 μL of extracted RNA template per reaction. The primer and probe sequences should target at least two independent viral regions (e.g., ORF1ab and N gene) with the following cycling conditions on a qualified real-time PCR instrument: reverse transcription at 50°C for 15 minutes; initial denaturation at 95°C for 2 minutes; followed by 45 cycles of denaturation at 95°C for 15 seconds and annealing/extension at 60°C for 1 minute with fluorescence acquisition. Include appropriate controls: positive extraction control, negative extraction control, positive amplification control, and no-template control to monitor for contamination and ensure assay validity.
Target-Specific Primer and Probe Design
Effective primer and probe design is paramount for sensitive and specific SARS-CoV-2 detection. For ORF1ab targeting, select regions with high sequence conservation identified through entropy analysis (e.g., zero Shannon's entropy regions) [34]. The primer pair ORF1ab-F (5'-ATGAGCTTAGTCCTGTTG-3') and ORF1ab-R (5'-CTCCCTTTGTTGTGTTGT-3') amplifies a 77 bp fragment, with the probe ORF1ab-P (5'-FAM-AGATGTCTTGTGCTGCCGGTA-BHQ1-3') providing detection [34]. For the N gene, the primer pair N-F (5'-GACCCCAAAATCAGCGAAAT-3') and N-R (5'-TCTGGTTACTGCCAGTTGAATCTG-3') generates a 72 bp product, detected with probe N-P (5'-FAM-ACCCCGCATTACGTTTGGTGGACC-BHQ1-3'). For the E gene, utilize the primer pair E-F (5'-ACAGGTACGTTAATAGTTAATAGCGT-3') and E-R (5'-ATATTGCAGCAGTACGCACACA-3') producing a 113 bp amplicon, with probe E-P (5'-FAM-ACACTAGCCATCCTTACTGCGCTTCG-BHQ1-3'). All probes should incorporate 5' fluorescent reporters (FAM, HEX) and 3' quenchers (BHQ-1, TAMRA), with amplicon sizes kept below 150 bp to optimize amplification efficiency. Implement dual-target assays that detect two independent viral regions to mitigate false negatives resulting from potential mutations.
Multiplex Assay Design for Enhanced Detection
Multiplex NAT designs that simultaneously target multiple SARS-CoV-2 genes significantly enhance detection reliability and provide built-in redundancy against emerging variants. A recommended approach combines ORF1ab with either the N or E gene, creating a dual-target system that maintains detection capability even if one target region acquires mutations. The ORF1ab gene serves as the primary target due to its high conservation and early expression profile, while the N gene provides secondary confirmation with its high expression level [34] [7]. For the multiplex reaction, design primers with similar melting temperatures (Tm ≈ 60°C) and minimal complementarity to prevent primer-dimer formation. Utilize distinct fluorescent reporters for each target (e.g., FAM for ORF1ab, HEX/VIC for N gene, Cy5 for E gene) to enable differential detection in the same reaction vessel. The Cobas SARS-CoV-2 MPX test exemplifies this approach, performing qualitative multiplex detection and discrimination of multiple viral targets in a single, fully automated test system [7]. This multiplex strategy is particularly valuable for identifying variants with mutations in the spike protein that might evade monoplex assays, while also providing internal validation through concurrent amplification of multiple targets.
Essential Research Reagents and Materials
Table 3: Research Reagent Solutions for SARS-CoV-2 NAT Development
| Reagent Category | Specific Examples | Function in NAT Protocol |
|---|---|---|
| RNA Extraction Kits | MagMAX Viral/Pathogen Nucleic Acid Isolation Kit, QIAamp Viral RNA Mini Kit | Nucleic acid purification and concentration |
| One-Step RT-qPCR Master Mixes | TaqPath 1-Step RT-qPCR Master Mix, Luna Universal Probe One-Step RT-qPCR Kit | Combined reverse transcription and amplification |
| Positive Control Templates | Synthetic RNA controls for ORF1ab, N, E genes | Assay validation and quantification standards |
| Primer/Probe Sets | ORF1ab, N, E gene-specific primers with dual-labeled probes | Target-specific amplification and detection |
| Instrument Systems | Cobas 6800/8800 Systems, ABI 7500 Fast Dx Real-Time PCR System | Automated nucleic acid testing platform |
| Quality Controls | Human RNase P primer-probe set, exogenous internal control | Sample adequacy and inhibition monitoring |
SARS-CoV-2 Genomic Organization and NAT Workflow
Diagram 1: SARS-CoV-2 Genomic Organization and NAT Target Selection Workflow. This diagram illustrates the relationship between the viral genome structure and optimal target selection for nucleic acid testing, highlighting the conserved ORF1ab region for early detection and structural genes for complementary confirmation.
NAT Experimental Protocol Workflow
Diagram 2: SARS-CoV-2 NAT Experimental Workflow. This diagram outlines the step-by-step procedure for nucleic acid testing, from specimen collection through RNA extraction, amplification, and final result interpretation, emphasizing the critical quality control checkpoints.
The strategic selection of viral gene targets forms the cornerstone of effective SARS-CoV-2 nucleic acid testing protocols. The conserved ORF1ab replicase complex provides an optimal target for early detection with high specificity, while structural genes (N, E) offer complementary targets for multiplex assay designs that enhance detection reliability [34] [7]. As SARS-CoV-2 continues to evolve with emerging variants, NAT protocols must adapt by targeting highly conserved regions and implementing dual-target systems that maintain efficacy despite genomic mutations. The integration of automated platforms like the Cobas 6800/8800 systems enables high-throughput testing with minimal turnaround times, addressing the critical need for rapid diagnostic results in both clinical and public health contexts [7]. Future developments in SARS-CoV-2 NAT will likely focus on multiplex panels that simultaneously detect SARS-CoV-2, influenza, RSV, and other respiratory pathogens, providing comprehensive diagnostic information from a single specimen. Additionally, the incorporation of digital PCR technologies may further enhance quantification accuracy and detection sensitivity, particularly in challenging specimen types with low viral loads. Through continued refinement of target selection and assay design, nucleic acid testing will remain an indispensable tool for pandemic response and respiratory pathogen diagnostics.
High-Throughput Laboratory Testing vs. Rapid Point-of-Care NAT Systems
The landscape of viral nucleic acid testing (NAT) has evolved into two predominant paradigms: centralized high-throughput laboratory systems and decentralized rapid Point-of-Care (POC) platforms. High-throughput systems, such as the cobas 6800/8800 systems (Roche) and the PANA HM9000 system, are designed for processing large batch samples in core laboratories, offering high automation and precision [37] [38]. In contrast, rapid POC NAT systems, including the Xpert Xpress SARS-CoV-2 (Cepheid) and Vivalytic VRI Panel (Bosch), provide decentralized, sample-to-answer solutions with short turnaround times, enabling testing in clinic-based or resource-limited settings [37] [39]. Within the broader thesis on viral NAT protocols, this analysis provides a structured comparison of their operational and performance characteristics, detailed application notes for implementation, and standardized experimental protocols for validation, serving as a comprehensive resource for researchers and drug development professionals.
Performance Comparison and Application Scenarios
The choice between high-throughput and POC NAT systems depends on clinical or research requirements, including testing volume, turnaround time, and resource availability. The table below summarizes the core characteristics of these systems.
Table 1: Comparative Analysis of High-Throughput Laboratory and Rapid POC NAT Systems
| Feature | High-Throughput Laboratory Testing | Rapid Point-of-Care (POC) NAT Systems |
|---|---|---|
| Throughput | High (e.g., ~2000 samples per day on PANA HM9000) [38] | Low to moderate (individual cartridge-based tests) [37] |
| Turnaround Time (TAT) | Several hours to days (includes batching and transport) [40] | Short (e.g., ~30 minutes for Xpert Xpress) [37] |
| Automation Level | Full automation (sample in, result out) [38] | Integrated, cartridge-based automation [37] |
| Typical Setting | Centralized, core laboratories [38] | Decentralized: clinics, emergency rooms, field settings [40] [41] |
| Assay Menu Flexibility | Broad, supports qualitative and quantitative pathogen detection [38] | Often targeted panels (e.g., SARS-CoV-2, HIV, Influenza) [37] [41] |
| Key Performance Metrics | Excellent precision (CV <5%), 100% concordance in validation studies, high linearity (⎥r⎥ ≥0.98) [38] | High specificity; sensitivity can be high for molecular POC (e.g., 92.8% pooled sensitivity) but lower for antigen-based POC (e.g., 70.6%) [42] |
| Personnel Requirements | Requires trained laboratory personnel | Can be operated by healthcare workers or trained non-experts [37] [39] |
| Cost Structure | High initial instrument cost, lower cost per test at scale | Lower initial instrument cost, higher cost per test [7] |
Application Scenarios:
- High-Throughput Systems are indispensable for large-scale screening, routine diagnostics in large hospitals, and viral load monitoring for chronic infections (e.g., HIV, HCMV) where high precision and quantitative results are critical [41] [38]. Their ability to run thousands of tests daily makes them ideal for population-level surveillance.
- Rapid POC Systems are transformative for time-sensitive clinical decision-making. This includes managing patients in emergency rooms (e.g., using rapid troponin I tests for myocardial infarction) [40], controlling outbreaks of infectious diseases (e.g., COVID-19, Influenza) by enabling immediate isolation and care [40] [42], and expanding testing access in remote communities with limited laboratory infrastructure, such as for HIV viral load monitoring in sub-Saharan Africa [41].
Experimental Protocols
Protocol 1: Validation of a High-Throughput NAT System
This protocol provides a framework for the comprehensive performance evaluation of a high-throughput automated NAT system, based on CLSI guidelines [38].
1. Objective: To validate the concordance, accuracy, precision, linearity, and limit of detection (LoD) of a high-throughput NAT system for pathogen detection (e.g., EBV, HCMV, RSV).
2. Materials:
- High-throughput NAT system (e.g., PANA HM9000).
- Validated commercial detection kits for target pathogens.
- Clinical specimens (residual patient samples) characterized as positive and negative by a reference method.
- WHO International Standards or National Reference Materials for the target pathogens.
- Potential interferents (e.g., hemoglobin, bilirubin).
3. Methodology:
- Concordance Rate: Test a panel of pre-characterized clinical samples (e.g., n=120 for EBV). Calculate positive, negative, and overall agreement percentages between the new system and the reference method per CLSI EP12 [38].
- Accuracy & Linearity: Serially dilute WHO standards in negative plasma matrix across a clinically relevant range (e.g., 10 IU/mL to 10^6 IU/mL). Test each dilution in triplicate. Compare mean measured values to theoretical values for accuracy assessment per CLSI EP09. Perform linear regression analysis per CLSI EP06 [38].
- Precision: Assess both intra-assay and inter-assay precision. For intra-assay precision, test multiple replicates (n≥3) of low and high concentration samples in a single run. For inter-assay precision, test the same samples over multiple days (n≥5). Calculate the coefficient of variation (CV); a CV <5% is typically acceptable [38].
- Limit of Detection (LoD): Prepare multiple replicates (n≥5) of the target pathogen at low concentrations near the expected LoD using a reference material. The LoD is the lowest concentration at which ≥95% of replicates test positive, as defined by CLSI EP17 [38].
- Interference & Cross-reactivity: Spike target analyte into samples containing potential interferents. Test panels of samples containing genetically or clinically related pathogens to assess cross-reactivity per CLSI EP07 [38].
- Carryover Contamination: Test high-positive samples followed by negative samples in sequence and check for any false-positive results in the negative samples [38].
4. Data Analysis: Use statistical software to perform regression and variance analysis. Report concordance rates, linear regression equations (slope, intercept, r²), and CV values.
Protocol 2: Evaluating a Rapid POC NAT Test Against a Laboratory Reference Standard
This protocol outlines the procedure for establishing the clinical sensitivity and specificity of a rapid POC NAT test.
1. Objective: To determine the diagnostic sensitivity and specificity of a rapid POC NAT test (e.g., Xpert Xpress SARS-CoV-2) using laboratory-based RT-PCR as the reference standard.
2. Materials:
- Rapid POC NAT test kits and platform.
- Laboratory-based RT-PCR platform and reagents.
- Paired respiratory samples (e.g., nasopharyngeal swabs) from symptomatic and asymptomatic individuals. Store samples in appropriate transport media if required by the POC test manufacturer [37].
3. Methodology:
- Sample Collection & Testing: Collect respiratory samples from participants. Split each sample for parallel testing: one part is tested immediately on the POC NAT device according to the manufacturer's instructions, and the other part is transported to the lab for RT-PCR testing [42]. Note that some POC tests may not validate certain transport media like PBS [37].
- Reference Standard Testing: Perform RT-PCR testing on the laboratory portion of the sample within a validated timeframe. Consider samples positive for SARS-CoV-2 if they are positive for at least two different target genes [37].
- Blinding: The personnel operating the POC test and the laboratory RT-PCR should be blinded to the results of the other test.
4. Data Analysis:
- Construct a 2x2 contingency table comparing POC test results (Positive/Negative) against the reference RT-PCR results (Positive/Negative).
- Calculate clinical sensitivity (True Positives / (True Positives + False Negatives)) and specificity (True Negatives / (True Negatives + False Positives)) with 95% confidence intervals.
- Perform subgroup analyses based on symptom onset (≤7 vs. >7 days) and RT-PCR cycle threshold (Ct) values, as viral load significantly impacts POC test sensitivity [42].
Technological Innovations and Workflows
The integration of machine learning (ML) and artificial intelligence (AI) is a key innovation, particularly for POC platforms. ML algorithms enhance POC diagnostics by:
- Improving Result Interpretation: Deep learning models, such as Convolutional Neural Networks (CNN) combined with Long Short-Term Memory (LSTM) networks, can analyze time-series images from lateral flow assays (LFAs). This reduces human error in reading faint test lines and has demonstrated the ability to achieve diagnostic accuracy exceeding 98% in as little as 1-2 minutes, faster than the standard 15-minute read time [40] [43].
- Enhancing Sensitivity and Multiplexing: Neural networks can process complex data from multiplexed vertical flow assays (VFAs), improving quantification accuracy and enabling the detection of multiple biomarkers or pathogens from a single sample [43].
- Assay Time Reduction: AI-based predictive diagnostics can analyze early assay signals to predict the final result, drastically reducing the required incubation or development time [40].
The following diagram illustrates the core workflow differences and technological integrations for the two testing paradigms.
The Scientist's Toolkit: Essential Research Reagent Solutions
The following reagents and reference materials are critical for developing and validating NAT protocols in both high-throughput and POC contexts.
Table 2: Key Research Reagents for NAT Protocol Development and Validation
| Reagent / Material | Function | Application Example |
|---|---|---|
| WHO International Standards | Provide a universally accepted reference for quantifying pathogen nucleic acids, ensuring accuracy and comparability across labs and assays. | Used to validate the accuracy and linearity of a high-throughput system for EBV and HCMV DNA quantification [38]. |
| National Reference Materials | Act as a nationally certified quality control material to standardize testing and ensure consistency within a country's laboratories. | Used as a qualitative standard for RSV RNA detection in system validation [38]. |
| Commercial NAT Kits | Optimized, ready-to-use mixtures of primers, probes, enzymes, and buffers for specific pathogen detection. | Allplex 2019-nCoV Assay (Seegene) for lab RT-PCR; Xpert Xpress cartridges (Cepheid) for POC testing [37] [42]. |
| Automated Nucleic Acid Extraction/Purification Kits | Reagents designed for use on automated platforms to isolate high-purity nucleic acids from clinical samples, critical for reproducibility. | Paired with instruments like the QIAsymphony (for labs) or integrated into POC cartridges for sample preparation [37] [38]. |
| Positive Control Materials | Samples with known, stable concentrations of the target pathogen, used in every run to verify the test is functioning correctly. | In-house prepared cell culture supernatants (e.g., SARS-CoV-2 Frankfurt 1) or commercial controls for serial dilution and LoD studies [37]. |
Nucleic acid testing (NAT) has become the benchmark in blood screening worldwide, significantly reducing the risk of transfusion-transmitted infections (TTIs) by directly detecting viral genomes during the window period before seroconversion [44] [45]. Two primary methodological approaches have emerged: individual donor NAT (ID-NAT) and minipool NAT (MP-NAT). The choice between these workflows presents significant operational, sensitivity, and resource considerations for blood screening facilities and researchers developing viral detection protocols. This application note provides a detailed comparative analysis of ID-NAT and MP-NAT methodologies, focusing on workflow efficiency, operational characteristics, and performance metrics within the context of viral nucleic acid testing protocol optimization.
Workflow Comparison and Procedural Framework
The fundamental operational difference between ID-NAT and MP-NAT lies in sample processing architecture before nucleic acid amplification. ID-NAT processes each donation individually through the entire testing process, while MP-NAT employs a two-stage testing algorithm where samples are first combined into pools [45].
Table 1: Core Workflow Characteristics of ID-NAT and MP-NAT
| Characteristic | ID-NAT Workflow | MP-NAT Workflow |
|---|---|---|
| Initial Processing | Direct testing of individual samples | Pooling of 6-16 donations before testing [46] [47] |
| Reactive Result Path | Donor deferred; unit discarded | Pool deconstructed; individual samples retested to identify reactive donation [45] [47] |
| Non-Reactive Result Path | Donor cleared; unit released | All donations in pool cleared for release [47] |
| Automation Compatibility | High on platforms like Panther | High on platforms like cobas 6800/8800 [44] |
| Result Turnaround Time | Generally consistent | Longer for reactive pools due to resolution testing |
Workflow Visualization
The following diagrams illustrate the fundamental decision pathways and procedural steps for each NAT methodology.
ID-NAT Workflow Pathway
MP-NAT Workflow Pathway
Performance and Sensitivity Analysis
The dilution effect inherent in MP-NAT presents critical sensitivity trade-offs, particularly for detection of low viral load infections.
Detection Sensitivity and Yield Rates
Multiple studies demonstrate that ID-NAT provides superior detection sensitivity for low-level viremia, particularly crucial for hepatitis B virus (HBV) detection where viral loads can be extremely low during the window period or in occult infections.
Table 2: Comparative NAT Yield and Sensitivity Analysis
| Parameter | ID-NAT Performance | MP-NAT Performance | References |
|---|---|---|---|
| Overall NAT Yield | 1:3242 donations [45] | 1:2281 donations [45] | |
| HBV NAT Yield | 1062.90 per million [46] | Varies with pool size & prevalence [46] | |
| Low VL HBV Detection | 88.88% detection of samples <20 IU/mL [48] | 16.66% detection at 1:8 dilution (samples <20 IU/mL) [48] | |
| Window Period Reduction | 35-91% for HIV-1, HCV, HBV [48] | 17-87% with MP-16 NAT [48] | |
| Impact of Pool Size | Not applicable | Sensitivity decreases with increasing pool size [47] |
A dilution study investigating low viral load HBV samples (<20 IU/mL) found that ID-NAT detected 88.88% of samples, while MP-NAT at 1:6-1:8 dilution detected only 16.66% of replicates, meaning more than 83% of low viral load samples were missed by the pooling approach [48]. This sensitivity reduction is attributed to the dilution of viral particles below the assay's detection limit when mixed with negative samples.
Analytical Sensitivity of Major NAT Platforms
The two predominant NAT platforms used worldwide demonstrate different sensitivity profiles that influence their application in ID-NAT versus MP-NAT workflows.
Table 3: Platform-Specific Analytical Sensitivity (95% LOD)
| Virus | cobas MPX (cp/mL) | Procleix Ultrio Elite (cp/mL) | References |
|---|---|---|---|
| HBV | 17.8 | 47.9 | [44] |
| HCV | 21.9 | 13.8 | [44] |
| HIV | 8.3 | 10.4 | [44] |
| Relative Sensitivity (HBV) | 3.20-fold higher | Reference | [44] |
The cobas MPX system demonstrated significantly higher sensitivity for HBV detection (3.20-fold higher than Ultrio Elite), making it particularly advantageous for MP-NAT implementations where dilution further reduces sensitivity [44]. For HCV, the Ultrio Elite system showed slightly better sensitivity [44].
Operational and Economic Considerations
Instrument Performance and Workflow Efficiency
Operational reliability and throughput significantly impact the choice between NAT methodologies, particularly in high-volume screening environments.
Table 4: Operational Characteristics Comparison
| Operational Factor | ID-NAT | MP-NAT | References |
|---|---|---|---|
| Reagent Cost per Test | Higher | Significantly lower (up to 75% reduction) [47] | |
| Initial Equipment Cost | Platform dependent | Platform dependent | |
| Throughput Capacity | Lower samples per run | Higher samples per run | |
| Invalid Test Rate | 1.9% (Panther) | 4.2% (cobas 6800) | [44] |
| Instrument Downtime | 6.6 hours (Panther) | 26 hours (cobas 6800) | [44] |
| Hands-on Time | Lower (fully automated) | Higher for pool resolution |
The Procleix Panther system demonstrated superior operational reliability with significantly lower downtime (6.6 hours vs. 26 hours for cobas 6800) and lower invalid test rates (1.9% vs. 4.2%) in a comparative study [44]. However, MP-NAT implementations can reduce reagent costs to approximately one-quarter of ID-NAT costs through pool testing strategies [47].
Detailed Experimental Protocols
Protocol 1: MP-NAT with Pool Resolution Algorithm
This protocol outlines the chessboard pooling technique for HCV NAT, adaptable for other viral targets [47].
Materials:
- EDTA-containing blood samples
- NAT-compatible plasma samples
- Roche COBAS AmpliPrep Instrument or equivalent
- COBAS TaqMan HCV Test or equivalent multiplex assay
- Sterile pipettes and pool containers
Procedure:
- Sample Preparation: Centrifuge EDTA blood samples at 10,000 rpm for 10 minutes. Harvest plasma.
- Bi-Dimensional Pooling: Arrange samples in a chessboard design with two-directional pooling:
- Create mini-pools of 6 samples (150 µL each donation, total 900 µL)
- Create corresponding mini-pools of 12 samples (75 µL each donation, total 900 µL)
- Each sample is represented in two pools (one 6-pool and one 12-pool)
- NAT Screening: Perform nucleic acid testing on all pools following manufacturer instructions.
- Reactive Pool Resolution: Identify reactive pools. The positive sample is located at the intersection of one reactive 6-pool and one reactive 12-pool.
- Confirmation: Retest the identified shared sample individually to confirm positivity.
- Management: Quarantine all donations sharing the reactive pools until confirmation is complete. Discard confirmed positive units.
Protocol 2: ID-NAT with Discriminatory Testing
This protocol details individual donation testing with confirmatory discrimination, particularly for use with TMA-based systems [45] [49].
Materials:
- Procleix Ultrio Elite Assay or equivalent
- Panther instrument or equivalent TMA platform
- Discriminatory assays for HBV, HCV, and HIV
- Primary donation tubes and plasma bag samples
Procedure:
- Sample Loading: Load individual donation samples in primary tubes onto the automated platform.
- Initial Screening: Perform multiplex NAT screening using triplex assay (HBV, HCV, HIV) in individual donation mode.
- Reactive Sample Handling: For initial reactive donations, test plasma bag samples in triplicate using the same NAT assay.
- Virus Discrimination: Perform discriminatory assays for HBV, HCV, and HIV on repeat reactive samples to identify the specific virus.
- Confirmatory Testing: Implement additional repeated discriminatory testing (3-repeated dHBV) for HBV to improve detection confidence in NAT+/HBsAg- cases [49].
- Donor Management: Defer reactive donors and initiate appropriate counseling and referral procedures.
The Scientist's Toolkit: Essential Research Reagents
Table 5: Key Research Reagent Solutions for NAT Implementation
| Reagent/Platform | Function | Application Notes |
|---|---|---|
| Procleix Ultrio Elite Assay | TMA-based multiplex detection of HIV-1/HIV-2, HCV, HBV | High sensitivity for HCV; used in ID-NAT format [44] [49] |
| cobas MPX Assay | PCR-based multiplex detection on 6800/8800 systems | Superior HBV sensitivity; compatible with MP-NAT and ID-NAT [44] [7] |
| Architect i2000SR Immunoassay | Chemiluminescence serological testing | Provides complementary serological data [7] |
| COBAS AmpliPrep/COBAS TaqMan | Automated nucleic acid extraction and real-time PCR | Enables laboratory-developed NAT [47] |
| NAT Internal Controls | Monitoring extraction and amplification efficiency | Essential for validating each test run |
The choice between ID-NAT and MP-NAT involves balancing sensitivity requirements with operational resources. ID-NAT provides maximum detection sensitivity for low viral load infections and streamlined workflow, making it preferable for regions with high HBV prevalence or for safeguarding vulnerable patient populations. MP-NAT offers significant cost savings and adequate sensitivity for many applications, particularly when implemented with optimized pool sizes and high-sensitivity platforms. Contemporary NAT protocols should consider prevalence of target infections, available resources, and the critical need to maintain blood safety while ensuring sustainable operations.
Overcoming Challenges and Optimizing NAT Performance
False negative results in viral nucleic acid testing (NAT) present a significant challenge in molecular diagnostics, potentially leading to delayed treatments, continued disease transmission, and inaccurate epidemiological data. The reliability of NAT protocols is critically dependent on several pre-analytical and analytical factors that can substantially impact test sensitivity. Within the broader thesis on optimizing viral NAT protocols, this application note systematically examines the influence of viral load dynamics, specimen type selection, and collection timing on false negative rates. Research indicates that the false negative rate of reverse transcription-polymerase chain reaction (RT-PCR) tests for SARS-CoV-2 can range from 2% to 29%, with some models showing apparent false negative rates from approximately 17% to 48% due to temporal viral load dynamics [50] [51]. This variability underscores the necessity for standardized protocols that address these critical factors. For researchers and drug development professionals, understanding and mitigating these variables is essential for developing accurate diagnostic tests, validating therapeutic efficacy, and conducting reliable clinical trials. This document provides detailed experimental protocols and data analysis frameworks to support the optimization of NAT systems in research settings.
The Fundamental Challenge of False Negatives in Viral NAT
False negatives in viral nucleic acid testing occur when a test incorrectly returns a negative result for an infected individual. The implications are particularly severe in contexts like pandemic control, where infected persons who receive false negative results may not isolate, potentially leading to further viral spread [51]. The probability of false negatives is not constant but is influenced by an intricate interplay of biological and technical factors.
Bayesian statistical principles demonstrate that in populations with high disease prevalence, false negative results become proportionally more prominent, even with the same test accuracy [52]. This probabilistic framework is crucial for researchers to consider when designing studies and interpreting results. The analytical error rate of immunoassays, which can range from 0.4% to 4%, further complicates test reliability [52]. For nucleic acid tests, the challenges are multifaceted, encompassing both the biological dynamics of infection and technical limitations of detection methodologies.
Table 1: Key Factors Contributing to False Negative Results in Viral NAT
| Factor Category | Specific Factor | Impact on False Negative Rate |
|---|---|---|
| Temporal Dynamics | Time since exposure | False negative rate highest immediately post-exposure, decreases as viral load increases |
| Time relative to symptom onset | Minimal detectability until approximately 2 days before symptom onset [50] | |
| Biological Factors | Viral load dynamics | Direct correlation between viral load and detection probability |
| Asymptomatic vs. symptomatic infection | Viral shedding patterns may differ, affecting detectability | |
| Specimen Considerations | Specimen type | Varying viral loads across different specimen types (nasopharyngeal, saliva, BAL) |
| Collection technique | Improper technique reduces viral yield | |
| Technical Factors | RNA extraction efficiency | Inefficient recovery reduces detectable nucleic acid |
| Assay sensitivity | Variations in primer/probe design and amplification efficiency | |
| Inhibitors in sample | Substances that interfere with amplification |
Impact of Viral Load Dynamics and Collection Timing
Temporal Patterns of Viral Load and Detectability
The relationship between viral load dynamics and detection probability is a critical determinant of NAT accuracy. Research utilizing stochastic agent-based models has demonstrated that the false negative rate is highly dynamic over the course of infection [50]. The period of undetectable virus during the initial incubation phase contributes to a high basal apparent false negative rate, regardless of test sensitivity.
Evidence suggests that detection and viral spread begin approximately 2 days before symptom onset [50]. One study found that false negative rates reach a minimum of approximately 25% two days after symptom onset [50]. This temporal pattern creates a challenging diagnostic window where individuals may be infectious yet test negative.
Table 2: Temporal Dynamics of False Negative Rates Relative to Symptom Onset
| Time Relative to Symptom Onset | False Negative Rate | Viral Load/Transmissibility |
|---|---|---|
| -3 days or earlier | ~100% | Insufficient for detection |
| -2 days | Decreasing from 100% | Beginning of detectability and transmission |
| Symptom onset (Day 0) | ~38% | High and transmissible |
| +2 days | ~25% (minimum) | Peak transmissibility |
| +8 days | ~38% | Declining but detectable |
| +14 days | ~67% | Low but potentially detectable |
Implications for Transmission and Testing Strategies
The pre-symptomatic transmission window significantly complicates control strategies. Based on serial interval data from transmission pairs, approximately 44% of SARS-CoV-2 transmission may occur prior to symptom onset [50]. This early transmissibility, combined with variable false negative rates, means that infected individuals may be most contagious during periods when testing is less likely to detect infection.
These dynamics have profound implications for testing strategies. Simple models assuming uniform viral spread and perfect tests may dramatically underestimate the testing frequency required to control outbreaks. Agent-based models suggest that with dynamic viral load and false negative rates, as much as 100% of a population may need daily testing to bring the effective reproduction number (Rt) below 1 when relying on testing alone [50]. For researchers designing surveillance studies or clinical trials, these temporal dynamics underscore the necessity of repeated testing rather than single-timepoint assessments.
Specimen Type Selection and Technical Considerations
Comparative Analysis of Specimen Types
The choice of specimen type significantly influences NAT sensitivity due to variations in viral load across anatomical sites. While nasopharyngeal swabs are most commonly used, studies reveal substantial discordance between upper and lower respiratory tract specimens for many viruses.
Research on respiratory syncytial virus (RSV) in immunocompromised adults demonstrated markedly different detection rates across specimen types: nasal wash (15%), endotracheal aspirate (71.4%), and bronchoalveolar lavage (BAL) (88.9%) [53]. Similarly, studies of adult hematopoietic stem cell transplant recipients showed high rates of discordance between upper and lower respiratory tract specimens for various viruses: adenovirus (100%), human metapneumovirus (44%), rhinovirus (34%), and parainfluenza virus type 3 (28%) [53].
Table 3: Detection Sensitivity Across Specimen Types for Various Respiratory Viruses
| Specimen Type | Approved for Commercial Assays | Target Viruses | Relative Sensitivity | Considerations |
|---|---|---|---|---|
| Nasopharyngeal swab | Most assays | Broad range | High for most viruses | Standard, minimally invasive |
| Nasal swab/aspirate | Many assays | Broad range | Moderate | Less invasive |
| Bronchoalveolar lavage (BAL) | Limited (e.g., FilmArray Pneumonia Panel) | Lower respiratory pathogens | Highest for lower tract infections | Invasive, requires specialized collection |
| Throat swab | Some assays | Broad range | Variable | Convenient but potentially lower sensitivity |
| Sputum | Limited assays | Lower respiratory pathogens | High for productive cough | Requires productive cough |
Technical Aspects of Specimen Collection and Processing
Proper specimen collection technique is crucial for minimizing false negatives. Inadequate sampling, improper storage, or delays in processing can significantly reduce viral RNA yield. For nasopharyngeal swabs, correct insertion depth and adequate rotation are essential to collect sufficient respiratory epithelial cells where viral replication occurs.
Transport conditions also critically impact test results. Most viral transport media maintain specimen integrity at 2-8°C for up to 72 hours, with longer storage requiring freezing at -70°C to prevent RNA degradation. RNA extraction efficiency varies considerably among different extraction systems, directly impacting sensitivity. Automated extraction systems generally provide more consistent recovery compared to manual methods.
For lower respiratory specimens like BAL, which often show higher viral loads, the invasive nature of collection limits routine use but remains valuable in immunocompromised patients or those with severe disease where upper respiratory specimens may test negative despite active infection [53].
Experimental Protocols for Assessing False Negatives
Protocol 1: Temporal Viral Load Kinetics Study
Objective: To characterize the relationship between time post-infection and viral load detection in experimental models.
Materials:
- Animal model or ex vivo system per research focus
- Viral stock with known titer
- Appropriate specimen collection materials (swabs, transport media)
- RNA extraction kit (e.g., QIAamp Viral RNA Mini Kit)
- RT-PCR reagents with target-specific primers/probes
- Real-time PCR instrument
Methodology:
- Inoculation: Administer viral inoculum at predetermined titer via relevant route (intranasal, etc.)
- Serial Sampling: Collect specimens (nasal swabs, blood, tissue samples) at multiple timepoints:
- Pre-inoculation (baseline)
- Every 12-24 hours post-inoculation for first 5 days
- Daily from day 5 to 14
- Additional timepoints based on viral kinetics of specific pathogen
- Processing:
- Extract RNA following manufacturer's protocol with inclusion of extraction controls
- Perform RT-PCR in duplicate or triplicate
- Include standard curve with known copy numbers for quantification
- Data Analysis:
- Plot viral load versus time post-inoculation
- Calculate false negative rate at each timepoint relative to total infected subjects
- Model viral growth and clearance kinetics using appropriate mathematical models
Visualization of Experimental Workflow:
Protocol 2: Comparative Specimen Type Evaluation
Objective: To evaluate the relative sensitivity of NAT across different specimen types.
Materials:
- Study subjects with confirmed or suspected infection
- Paired specimen collection kits (nasopharyngeal swabs, nasal swabs, saliva collection devices, etc.)
- Standardized transport media
- RNA extraction kits
- RT-PCR reagents
- Equipment for specimen processing (centrifuge, vortex)
Methodology:
- Subject Enrollment: Recruit subjects across spectrum of disease severity (asymptomatic, mild, severe)
- Paired Collection: Collect different specimen types from each subject within 2-hour window:
- Nasopharyngeal swab
- Anterior nasal swab
- Saliva sample (1-2 mL)
- Optional: lower respiratory specimens when clinically indicated
- Processing:
- Process all specimens using identical RNA extraction method
- Use same RT-PCR assay for all specimens
- Include appropriate controls (positive, negative, extraction)
- Analysis:
- Compare Ct values across specimen types using ANOVA with repeated measures
- Calculate detection rates for each specimen type
- Assess concordance between specimen types using kappa statistics
Protocol 3: Limit of Detection and Assay Sensitivity
Objective: To determine the limit of detection (LOD) and probability of detection across viral load ranges.
Materials:
- Synthetic RNA standards or viral culture with known titer
- Negative clinical matrix (e.g., pooled negative nasopharyngeal specimens)
- Serial dilution equipment
- RT-PCR reagents and equipment
Methodology:
- Preparation of Dilutions:
- Prepare 10-fold serial dilutions of standard in negative matrix
- Include additional 2-fold dilutions around expected LOD
- Testing:
- Test each dilution in at least 20 replicates
- Perform testing across different days and by different operators
- Include appropriate controls
- Analysis:
- Calculate detection rate at each concentration
- Determine LOD as concentration where ≥95% replicates test positive
- Plot probability of detection versus viral concentration
- Fit probit or logistic regression model to data
Research Reagent Solutions
Table 4: Essential Research Reagents for False Negative Investigation Studies
| Reagent/Material | Function | Example Products | Application Notes |
|---|---|---|---|
| Viral Transport Media | Preserves specimen integrity during transport and storage | Copan UTM, BD Universal Viral Transport | Maintain viral RNA stability; validate compatibility with extraction methods |
| RNA Extraction Kits | Isolation of high-quality viral RNA | QIAamp Viral RNA Mini Kit, MagMAX Viral/Pathogen Kit | Automated systems provide better consistency; include carrier RNA for improved recovery |
| RT-PCR Master Mixes | Amplification of target viral sequences | TaqPath RT-PCR COVID-19 Kit, Luna Universal Probe One-Step RT-qPCR | Select based on sensitivity, specificity, and compatibility with platform |
| Synthetic RNA Controls | Standard curve generation and assay validation | Twist Synthetic SARS-CoV-2 RNA Control | Essential for quantifying copy number and determining LOD |
| Inhibition Controls | Detection of PCR inhibitors in clinical specimens | Exogenous Internal Control, MS2 Phage Control | Critical for distinguishing true negatives from false negatives due to inhibition |
| Primer/Probe Sets | Target-specific detection | CDC 2019-nCoV RUO Kit, custom designs | Target conserved regions; multiple targets reduce false negatives from sequence variation |
Data Analysis and Interpretation Framework
Statistical Approaches for False Negative Assessment
Robust statistical analysis is essential for interpreting data from false negative studies. Bayesian approaches are particularly valuable for calculating the probability of infection given a negative test result, incorporating pre-test probability based on population prevalence and clinical symptoms [52]. This method helps researchers understand the real-world performance of NAT tests beyond controlled laboratory conditions.
For temporal studies, mixed-effects models can account for both within-subject and between-subject variability in viral load trajectories. These models can identify factors associated with prolonged detectability and estimate the optimal testing intervals for surveillance programs. Survival analysis techniques, such as Kaplan-Meier curves and Cox proportional hazards models, can be used to analyze time to conversion from negative to positive and time to conversion from positive to negative.
Modeling Population-Level Impact
Mathematical modeling provides powerful tools for understanding the population-level implications of false negatives. SEIARD (Susceptible-Exposed-Infected-Asymptomatic-Recovered-Death) models, which incorporate asymptomatic carriers, have demonstrated that increasing nucleic acid testing frequency reduces the basic reproduction number (R₀) of infections [54]. These models can simulate how different testing strategies (e.g., test frequency, target populations) affect outbreak control.
Agent-based models, which simulate interactions between individuals in a population, have shown that the combination of pre-symptomatic transmission and dynamic false negative rates significantly increases the testing frequency required to control outbreaks compared to models assuming uniform transmission and test sensitivity [50]. These findings highlight the importance of incorporating real-world test performance data into epidemiological models.
Mitigation Strategies and Future Directions
Protocol Optimization Recommendations
Based on current evidence, several strategies can minimize false negative rates in viral NAT:
- Optimal Timing: Schedule testing relative to known exposure when possible; consider the viral kinetics of the specific pathogen
- Serial Testing: Implement repeated testing protocols for high-risk scenarios rather than relying on single timepoint testing
- Specimen Selection: Use lower respiratory tract specimens when clinically appropriate and feasible for improved detection in severe cases
- Technical Validation: Regularly verify RNA extraction efficiency and assay sensitivity using standardized controls
- Inhibition Monitoring: Include internal controls in each specimen to identify potential false negatives due to PCR inhibitors
Emerging Technologies and Research Needs
Future research should focus on several key areas to address the challenge of false negatives:
- Alternative Biomarkers: Investigation of viral antigens, host response markers, or combinatorial approaches to improve early detection
- Novel Amplification Technologies: Development of isothermal amplification methods that may offer improved sensitivity compared to traditional RT-PCR
- Point-of-Care Systems: Validation of rapid molecular testing platforms for decentralized testing with sensitivity comparable to laboratory-based methods
- Standardized Panels: Creation of well-characterized reference materials for consistent assay validation across laboratories
Interrelationship of Factors Affecting False Negatives:
The systematic investigation of factors contributing to false negatives in viral nucleic acid testing remains a critical component of molecular diagnostics research. Through rigorous characterization of viral load dynamics, optimization of specimen selection, and implementation of standardized protocols, researchers can significantly enhance the reliability of NAT systems. The protocols and analytical frameworks presented in this document provide a foundation for advancing this important field, ultimately supporting more accurate diagnosis, improved therapeutic development, and enhanced public health responses to viral threats.
The detection of low viral loads and occult infections represents a critical frontier in clinical virology and public health. Occult hepatitis B infection (OBI), defined as the presence of hepatitis B virus (HBV) DNA in the liver (with or without detectable HBV DNA in serum) in individuals testing negative for the hepatitis B surface antigen (HBsAg), poses significant diagnostic challenges [55] [56]. Similarly, monitoring low-level viremia in HIV patients despite antiretroviral therapy requires exceptionally sensitive detection methods [57]. The limitations of conventional serological testing become particularly apparent for these infections, as they often rely on antigen or antibody detection that may fall below threshold levels in occult presentations. This application note provides detailed protocols and strategic frameworks for optimizing nucleic acid testing (NAT) methodologies to enhance detection sensitivity for low viral loads and occult infections, with applications across HIV, HBV, and other viral pathogens.
Quantitative Comparison of Detection Method Performance
Table 1: Performance Characteristics of Viral Detection Technologies
| Detection Method | Effective Sensitivity | Key Advantages | Limitations | Best Application Context |
|---|---|---|---|---|
| Digital PCR (RT-dPCR) | 3-10 copies/μL [58] | Absolute quantification without standard curves; Lower coefficient of variation (11%) than qPCR [58] | Higher cost; Specialized equipment required | Gold standard for absolute viral load quantification; Confirmation of low-level results |
| Real-Time PCR (RT-qPCR) | >10 copies/μL (varies by assay) [58] | Widely available; Established protocols; High throughput | Requires standard curves; Higher variability (23% CV) [58] | Routine viral load monitoring; High-throughput screening |
| Nested PCR | Varies with primer efficiency [56] | High sensitivity with optimized primers; Can detect multiple genomic regions | High contamination risk; Labor-intensive | OBI diagnosis; Research applications for novel targets |
| Antigen Testing | Significantly lower than NAATs [4] [5] | Rapid results; Low cost; Point-of-care use | Poor sensitivity for asymptomatic cases (55%) [4] | Rapid screening in high-prevalence settings; Symptomatic individuals |
The selection of an appropriate detection platform depends on the specific diagnostic question. For absolute quantification of viral load at the lowest limits of detection, digital PCR provides superior precision. One study demonstrated that RT-dPCR had significantly greater precision than RT-qPCR, with a lower coefficient of variation/standard error of the mean (CV/SEM) and a higher detection limit for occult RNA viruses [58]. For OBI detection, where viral DNA is usually present at very low levels (<200 IU/mL) [55], methods with the highest sensitivity are required, often employing a multi-target approach to overcome potential sequence variations.
Experimental Protocols for Enhanced Detection
Protocol 1: Detection of Occult Hepatitis B via Multi-Region PCR
This protocol, adapted from Sosa-Jurado et al. (2018), is designed to maximize detection sensitivity for OBI by simultaneously targeting multiple conserved regions of the HBV genome to compensate for potential sequence variations and low viral copy numbers [56].
Materials & Reagents:
- QIAamp UltraSens Virus Kit (Qiagen)
- PCR Master Mix (e.g., Promega)
- Primer sets targeting PreS1, PreS2, S, P, X, PreC, and Core regions [56]
- Agarose gel electrophoresis equipment
- Cloning vector (e.g., pJET1.2/blunt Cloning Vector)
Procedure:
- Nucleic Acid Extraction: Extract total DNA from 1 mL of serum using the QIAamp UltraSens Virus Kit, following the manufacturer's instructions. For samples with expected very low viral loads, consider a prior concentration step using polyethylene glycol precipitation [56].
- Primer Design and Validation: Design primer pairs to amplify fragments of 454-1158 bp in the first-round PCR. For the subsequent nested PCR, design inner primers to generate amplicons of 236-644 bp. Conserved binding sites must be identified by aligning complete genome sequences of the HBV genotypes prevalent in the target population [56].
- First-Round PCR Amplification:
- Set up reactions using 200 nM of each outer primer.
- Use the following thermocycling conditions, optimizing the annealing temperature for each primer pair (range: 45°C to 68°C):
- Denaturation: 95°C for 5 min
- 35-40 cycles of: 95°C for 30 sec, [Optimized Ta] for 30 sec, 72°C for 1 min
- Final extension: 72°C for 7 min
- Nested PCR:
- Use 1-2 µL of the first-round PCR product as a template.
- Use 200 nM of each inner primer.
- Use thermocycling conditions similar to the first round, with an optimized annealing temperature.
- Analysis and Confirmation:
- Visualize PCR products by 1% agarose gel electrophoresis.
- Confirm the identity of amplicons by Sanger sequencing using their respective primers.
- A sample is considered positive for OBI if HBV DNA is detected in at least three different viral genomic regions [56].
Protocol 2: Absolute Quantification of Low Viral Loads using Digital PCR
This protocol utilizes microfluidic digital PCR for the absolute quantification of viral nucleic acids without the need for a standard curve, making it ideal for occult infections and validating low-level viremia [58].
Materials & Reagents:
- Microfluidic digital PCR chip (e.g., Fluidigm 48.770 chip)
- Reverse transcriptase (for RNA viruses)
- TaqMan probe master mix
- Locked-nucleic acid (LNA) TaqMan probes (optional, for enhanced specificity)
- Nucleic acid extraction kit
Procedure:
- Sample Preparation: Extract viral nucleic acid (DNA or RNA) using a validated method. For RNA viruses, perform reverse transcription to generate cDNA.
- Assay Design: Design primers and probes targeting a highly conserved region of the viral genome, such as the 5'-untranslated region (5'-UTR) for many viruses [58].
- Chip Loading and Partitioning:
- Prepare the PCR reaction mix according to the manufacturer's instructions.
- Load the mixture onto the microfluidic chip. The chip will physically partition the sample into 770s of individual nanoliter-scale reactions.
- Amplification:
- Run the chip on an appropriate thermocycler using optimized conditions for the TaqMan assay. A typical program is:
- Enzyme activation: 95°C for 10 min
- 40-45 cycles of: 95°C for 15 sec, 58-60°C for 1 min
- Run the chip on an appropriate thermocycler using optimized conditions for the TaqMan assay. A typical program is:
- Endpoint Analysis and Quantification:
- After amplification, analyze each chamber for a positive (fluorescent) or negative signal.
- The absolute copy number concentration in the original sample is calculated directly using Poisson statistics based on the ratio of positive to negative chambers, without reference to a standard curve [58].
Strategic Workflow for Optimal Detection Sensitivity
The following diagram illustrates a recommended decision-making workflow for applying the described protocols to achieve optimal detection sensitivity for low viral loads and occult infections.
The Scientist's Toolkit: Research Reagent Solutions
Table 2: Essential Reagents and Kits for Sensitive Viral Detection
| Reagent / Kit | Primary Function | Key Features for Sensitivity | Example Application |
|---|---|---|---|
| QIAamp UltraSens Virus Kit | Nucleic acid extraction from serum/plasma | Optimized for low-copy number targets; processes 1mL sample volume [56] | OBI detection from patient serum [56] |
| High Pure Viral Nucleic Acid Kit | Nucleic acid extraction | Efficient purification from various sample types; suitable for PCR | HBV DNA extraction from serum for in-house PCR [55] |
| Locked-Nucleic Acid (LNA) Probes | Enhanced probe binding in qPCR/dPCR | Increased thermal stability and mismatch discrimination; allows use of ultra-short probes [58] | GBV-C viral load measurement in dPCR [58] |
| Power SYBR Green / ROX Master Mix | Real-time PCR detection | Sensitive intercalating dye chemistry for qualitative detection | Qualitative real-time PCR for HBV [56] |
| Microfluidic dPCR Chips | Absolute quantification by partitioning | Partitions sample into 100s-1000s of reactions for single-molecule counting [58] | Absolute viral load measurement for occult RNA viruses [58] |
| pJET1.2/blunt Cloning Vector | PCR product cloning | High-efficiency cloning for sequencing confirmation | Verification of HBV sequences from OBI patients [56] |
The strategies outlined herein are critical for addressing the diagnostic challenges posed by occult infections and low-level viremia. In the context of HIV, improved monitoring of low viral loads is essential for achieving the UNAIDS 95-95-95 targets, as dolutegravir-based regimens demonstrate significantly reduced odds of virologic failure [57]. For OBI, the multi-target PCR approach is necessary due to the potential for mutations, such as those in the "a" determinant of the surface antigen, which can lead to diagnostic failures with standard assays [56]. Furthermore, the application of abstraction-based models for the programmable design of isothermal nucleic acid diagnostic assays presents a promising future direction, enabling the creation of sensitive tests for highly variable viruses like HIV or for very short targets like miRNA [59].
In conclusion, optimizing sensitivity for detecting low viral loads and occult infections requires a multi-faceted strategy. This includes selecting the appropriate amplification technology (e.g., dPCR for absolute quantification), employing multi-region amplification to overcome viral diversity, and utilizing specialized reagents designed for low-copy number detection. The protocols and frameworks provided in this application note offer researchers and clinicians a structured approach to enhance the accuracy and reliability of viral detection in the most challenging diagnostic scenarios.
Within the framework of viral Nucleic Acid Testing (NAT) protocols, the recovery and purification of nucleic acids from challenging matrices represents a critical pre-analytical step that directly influences the sensitivity, specificity, and overall success of downstream molecular diagnostics. Challenging matrices—such as processed food samples, forensic bone material, and respiratory specimens containing potent PCR inhibitors—present unique obstacles including the presence of complex contaminants, extensive nucleic acid degradation, and low pathogen load [60] [61]. Efficient extraction from these samples is paramount for accurate detection of viral targets in applications ranging from clinical diagnostics to food safety surveillance. This document provides detailed application notes and protocols, grounded in recent research, to enhance nucleic acid yield and purity from such difficult samples, thereby strengthening the reliability of subsequent NAT protocols.
Key Challenges in Nucleic Acid Extraction from Complex Matrices
The effectiveness of viral NAT protocols is often compromised when dealing with challenging sample types. Understanding the specific barriers to efficient nucleic acid recovery is the first step in overcoming them.
- Inhibitor Presence: Complex biological matrices like chestnut rose juice beverages, whole blood, and sputum often contain polysaccharides, polyphenols, proteins, and organic acids that can co-purify with nucleic acids and potently inhibit downstream enzymatic reactions like PCR [61]. Similarly, reagents used in extraction protocols, such as EDTA (used for bone demineralization) and guanidine salts (used in lysis buffers), can themselves become PCR inhibitors if not thoroughly removed during washing steps [60] [62].
- Nucleic Acid Degradation: Viral nucleic acids, particularly RNA, are inherently labile and susceptible to degradation. This process is accelerated in challenging samples. The primary mechanisms of degradation include:
- Oxidation and Hydrolysis: Exposure to heat, UV radiation, or acidic conditions (common in processed foods and beverages) can lead to base modifications and strand breaks [60] [61].
- Enzymatic Breakdown: Ribonucleases (RNases) and deoxyribonucleases (DNases) are ubiquitous and can rapidly degrade target nucleic acids if not inactivated immediately upon sample lysis [60].
- Low Target Abundance: In many clinical scenarios, such as early-stage infection or sepsis, the concentration of the viral pathogen in the sample can be extremely low, demanding extraction methods with exceptionally high efficiency to capture sufficient material for detection [62].
Optimized Extraction Methodologies
Selecting and optimizing the extraction protocol is crucial for managing the challenges outlined above. The following section details validated methodologies.
Protocol 1: High-Yield Magnetic Silica Bead-Based Extraction (SHIFT-SP)
This protocol, adapted from a 2025 study, is designed for speed and maximum recovery of nucleic acid, making it suitable for processing numerous samples or detecting low-abundance targets [62].
Principle: Nucleic acids bind to silica-coated magnetic beads in the presence of chaotropic salts and a binding buffer at optimized pH. Beads are separated using a magnet and washed before elution.
- Workflow Overview:
Materials:
- Lysis/Binding Buffer (LBB): Contains guanidine thiocyanate (a chaotropic salt) and Triton X-100, adjusted to pH 4.1 to enhance binding efficiency by reducing electrostatic repulsion between the negatively charged silica and nucleic acids [62].
- Silica-coated Magnetic Beads: 10-50 μL volume, adjusted based on expected nucleic acid load [62].
- Washing Buffer: A novel solution composed of 50% glycerol and 50% ethanol, which achieves effective purification in a single, abbreviated cycle [63].
- Elution Buffer: Low-ionic-strength solution, typically Tris-EDTA (TE) buffer or nuclease-free water.
- Equipment: Magnetic separator, thermomixer capable of maintaining 62°C, pipettes.
Step-by-Step Procedure:
- Lysis: Mix 200 μL of sample (e.g., viral transport medium, enriched whole blood) with 500 μL of LBB in a 1.5 mL microcentrifuge tube.
- Binding: Add 30-50 μL of magnetic bead suspension to the lysate.
- Critical Step: Perform "tip-based binding" by repeatedly aspirating and dispensing the mixture with a pipette for 1-2 minutes while incubating at 62°C. This dynamic mixing exposes beads to the entire sample volume more effectively than orbital shaking, increasing binding efficiency and reducing time [62].
- Separation: Place the tube in a magnetic separator until the solution clears. Carefully remove and discard the supernatant.
- Washing: Add 300 μL of the glycerol/ethanol washing buffer to the pelleted beads. Resuspend by vortexing for 1 minute. Separate magnetically and discard the supernatant.
- Elution: Remove the tube from the magnet. Add 50-100 μL of pre-warmed (56°C) elution buffer. Mix thoroughly and incubate at 56°C for 1 minute to facilitate nucleic acid release. Place the tube back on the magnetic separator and transfer the eluate containing the purified nucleic acid to a new tube.
- Storage: Purified nucleic acids should be stored at -80°C if not used immediately.
Protocol 2: Rapid Five-Minute Extraction (FME) for Respiratory Viruses
This protocol is optimized for speed in clinical settings where rapid turnaround for respiratory virus detection is critical, such as for influenza A virus (IAV) and RSV [63].
Principle: This method uses a specialized lysis solution and a unique washing buffer to rapidly isolate nucleic acids bound to magnetic beads, minimizing hands-on time.
- Workflow Overview:
Materials:
- FME Lysis Solution: Contains Guanidine Thiocyanate (GTC), sodium citrate, sarkosyl, DTT, PEG 6000, and isopropyl alcohol (IPA) [63].
- FME Washing Solution: 50% glycerol, 50% ethanol.
- FME Elution Solution: Tris-HCl (pH 8.0) with EDTA.
- Magnetic Beads
- Equipment: Vortex mixer, magnetic separator, heating block or thermomixer.
Step-by-Step Procedure:
- Lysis and Binding: Combine 200 μL of sample (e.g., nasopharyngeal swab in transport media) with 500 μL of FME lysis solution and 40 μL of magnetic beads in a 1.5 mL tube. Vortex mix for 1 minute.
- Separation: Place the tube on a magnetic separator. After the solution clears, discard all supernatant.
- Washing: Add 300 μL of FME washing solution to the beads. Vortex for 1 minute. Place the tube back on the magnetic separator and discard the supernatant.
- Elution: Add 100 μL of FME elution solution to the beads. Incubate at 56°C for 1 minute without mixing. Separate magnetically and transfer the entire supernatant (eluted nucleic acid) to a new tube. The process takes approximately 5 minutes.
- This method has been clinically validated, showing a 95.43% coincidence rate with a standard magnetic bead method for IAV detection [63].
Protocol 3: Combined Mechanical and Chemical Lysis for Tough Matrices
This approach is essential for recalcitrant samples like forensic bone, plant tissues, or bacterial spores, where mechanical disruption is necessary.
Principle: Combines physical homogenization with optimized chemical lysis to break down tough structures and release nucleic acids while preserving their integrity [60].
- Key Considerations:
- Mechanical Homogenization: Use instruments like a Bead Ruptor Elite with ceramic or stainless-steel beads. Parameters (speed, cycle duration, temperature) must be optimized to balance effective lysis with minimizing DNA shearing. For sensitive samples, a cryo-cooling unit can be used to reduce thermal degradation [60].
- Chemical Demineralization/Softening: For bone samples, a "combo power punch" using EDTA to demineralize the bone matrix is required. The concentration and incubation time of EDTA must be carefully balanced, as it is a known PCR inhibitor [60].
- Inhibitor Removal: Subsequent purification steps using silica-based columns or magnetic beads (as in Protocols 1 and 2) are crucial to remove inhibitors introduced during the initial lysis and homogenization.
Comparative Performance Data of Extraction Methods
The choice of extraction method significantly impacts the yield, quality, and processing time, which are critical for high-sensitivity NAT. The table below summarizes a comparative evaluation of different methods used on a challenging matrix (Chestnut rose juices and beverages) [61] and other relevant techniques.
Table 1: Comparative Analysis of Nucleic Acid Extraction Methods for Challenging Matrices
| Extraction Method | Average Time | Key Advantage | Key Limitation | Reported Yield / Quality (qPCR) | Best Suited For |
|---|---|---|---|---|---|
| SHIFT-SP [62] | 6-7 min | Highest yield and speed; automation-compatible | Requires optimization of bead volume and mixing | Near 100% yield reported; high purity | Low-abundance targets; high-throughput labs |
| Five-Minute Extraction (FME) [63] | ~5 min | Fastest; clinically validated for viruses | Specialized reagent formulation needed | High concentration and purity; 95.43% clinical coincidence | Rapid clinical diagnostics (e.g., IAV, RSV) |
| Combination Approach [61] | >60 min | Effective for highly processed, inhibitor-rich samples | Time-consuming and higher cost | Highest performance in complex food matrices | Processed foods, forensic samples, tough tissues |
| Non-commercial CTAB [61] | ~60 min | Low cost | Poor DNA quality; high inhibitor carryover | Low performance in qPCR | Limited to non-critical applications |
| Magnetic Bead (Commercial) [62] | ~40 min | Robust; automatable | Lower yield compared to SHIFT-SP | Similar yield to SHIFT-SP | General purpose use |
| Spin Column (Commercial) [62] [61] | ~25 min | Widely available; simple | Lower yield; risk of shearing | Half the DNA yield of SHIFT-SP | Routine samples with good starting material |
The Scientist's Toolkit: Essential Research Reagent Solutions
A successful nucleic acid extraction protocol relies on a suite of key reagents, each performing a critical function in the workflow.
Table 2: Key Reagents for Nucleic Acid Recovery from Challenging Matrices
| Reagent / Material | Function | Example / Key Component |
|---|---|---|
| Chaotropic Salts | Denature proteins and facilitate binding of nucleic acids to silica surfaces. | Guanidine thiocyanate (GTC), Guanidine HCl [62] [63] |
| Magnetic Silica Beads | Solid-phase matrix for binding, washing, and eluting nucleic acids; enable automation. | Silica-coated superparamagnetic particles [62] [64] |
| Lysis/Binding Buffer | Cell membrane disruption and creation of optimal conditions for nucleic acid binding. | Contains chaotropic salts, detergent (Triton X-100, Sarkosyl), and buffering agent at optimized pH (e.g., 4.1) [62] [63] |
| Novel Washing Buffer | Removes contaminants and salts without overdrying beads, improving inhibitor removal and speed. | 50% Glycerol / 50% Ethanol [63] |
| Elution Buffer | Releases purified nucleic acids from the solid-phase matrix in a low-salt environment. | Tris-EDTA (TE) Buffer or Nuclease-free Water [62] |
| Mechanical Homogenization Beads | Physically disrupt tough cellular and matrix structures for efficient lysis. | Ceramic or stainless-steel beads [60] |
| Demineralization Agents | Break down mineralized structures (e.g., bone) to access encapsulated nucleic acids. | Ethylenediaminetetraacetic acid (EDTA) [60] |
Optimizing the nucleic acid recovery and purification step is a non-negotiable prerequisite for robust and reliable viral NAT protocols, especially when dealing with challenging sample matrices. The protocols and data presented here demonstrate that recent advancements focus on increasing speed without compromising yield (e.g., SHIFT-SP, FME), combining disruption methods for tough samples, and employing novel chemistries (e.g., glycerol/ethanol wash) to enhance purity. The choice of method must be guided by the specific sample type, the required throughput, and the constraints of the clinical or research setting. By implementing these optimized application notes and protocols, researchers and diagnosticians can significantly enhance the sensitivity and accuracy of their molecular testing workflows.
In viral nucleic acid testing (NAT), the accuracy of quantitative results is paramount for effective patient management, therapeutic monitoring, and disease diagnosis [65]. A significant challenge in achieving this accuracy is the presence of inhibitory substances and interfering factors in clinical specimens that can compromise nucleic acid amplification [66]. These inhibitors can lead to false-negative results, reduced sensitivity, and inaccurate viral load quantification, ultimately affecting clinical decision-making [66]. This application note provides a detailed framework for identifying, evaluating, and mitigating the effects of amplification inhibitors, with a specific focus on hemoglobin as a model interferent and a comparison of nucleic acid extraction techniques. The protocols and data presented are designed for researchers and scientists developing and validating NAT protocols for viral load testing in clinical and research settings.
Background: Amplification Inhibition in Viral NAT
Nucleic acid amplification techniques, including PCR, form the cornerstone of modern viral load monitoring for pathogens such as Human Immunodeficiency Virus (HIV), Hepatitis B Virus (HBV), Hepatitis C Virus (HCV), and Human Papillomavirus (HPV) [65]. The reliability of these tests depends on the quality and purity of the extracted nucleic acids. Inhibitory substances can originate from the sample collection process (e.g., hemoglobin from blood-contaminated swabs), the patient (e.g., endogenous substances, medications), or the laboratory reagents (e.g., phenol, heparin) [66]. Their mechanisms of action include degradation of nucleic acids, interference with cell lysis, capture, or washing steps, and direct inhibition of polymerase enzymes during amplification. The impact can range from a slight reduction in amplification efficiency to complete reaction failure.
Experimental Data: Quantitative Comparison of Extraction Method Resilience
A critical factor in managing inhibition is the choice of nucleic acid extraction method. The following data summarizes a comparative study evaluating the anti-interference capability and clinical detection rates of two common DNA extraction methods: the traditional boiling method and the magnetic bead-based method [66].
Table 1: Anti-Hemoglobin Interference Capability of Nucleic Acid Extraction Methods
| Hemoglobin Concentration (g/L) | Boiling Method (HPV Detection) | Magnetic Bead Method (HPV Detection) |
|---|---|---|
| 20 g/L | Positive | Positive |
| 30 g/L | Negative | Positive |
| 60 g/L | Not Tested | Positive |
Source: Adapted from [66]. The experiment simulated blood-contaminated cervical swab specimens by mixing HPV positive controls with varying concentrations of hemoglobin.
Table 2: Clinical HPV Detection Rates: Boiling vs. Magnetic Bead Method
| Study Scale | Sample Size | Boiling Method Positive Rate | Magnetic Bead Method Positive Rate | P-value |
|---|---|---|---|---|
| Paired Small-scale | 639 cases | 10.02% | 20.66% | < 0.001 |
| Longitudinal Large-scale | 16,540 cases | Data not specified | Significantly higher than boiling | < 0.001 |
Source: Adapted from [66]. The McNemar test was used for the paired sample comparison.
Detailed Experimental Protocols
Protocol 1: Evaluating Hemoglobin Interference on Nucleic Acid Amplification
This protocol is designed to simulate the effect of blood contamination in clinical samples (e.g., cervical swabs) and to evaluate the resilience of any nucleic acid extraction or amplification method to hemoglobin interference.
1. Reagents and Equipment:
- EDTA-anticoagulated whole blood specimen
- Distilled water
- HPV positive quality control material (or other relevant viral positive control)
- Nucleic acid extraction kits (Boiling method and Magnetic bead method)
- Tellgenplex HPV27 DNA genotyping Test system or equivalent PCR platform [66]
- Microcentrifuge
- 100°C metal bath or heating block
- Automated nucleic acid extraction system (e.g., PANA 9600 s) [66]
2. Procedure: 1. Prepare a serial dilution of the whole blood specimen (starting hemoglobin: 120 g/L) with distilled water to create concentrations of 120, 100, 80, 60, 40, 30, 20, 16, 12, 8, 4, and 0 g/L [66]. 2. Mix the HPV positive control specimen with each diluted whole blood sample in a 1:1 ratio. This results in final hemoglobin concentrations of 60, 50, 40, 30, 20, 15, 10, 8, 6, 4, 2, and 0 g/L in the positive control [66]. 3. For each concentration, perform nucleic acid extraction in parallel using both the boiling method and the magnetic bead method. - Boiling Method: Centrifuge 300 µL of the mixed specimen, discard supernatant, add 200 µL of nucleic-acid extraction reagent (e.g., CheLex 100), mix thoroughly, incubate at 100°C for 15 min, and centrifuge at 14,000 rpm for 5 min. Use 5 µL of supernatant for PCR [66]. - Magnetic Bead Method: Use an automated system (e.g., PANA 9600 s) with a dedicated kit (e.g., qEx-DNA/RNA virus T183). Load 300 µL of sample and run the automated protocol for lysis, magnetic attraction, washing, and elution. Use 5 µL of eluate for PCR [66]. 4. Perform HPV-DNA genotyping testing via PCR amplification, hybridization, and fluorescence detection on all extracted samples. Test each sample in triplicate. 5. Analysis: Record the phycoerythrin fluorescence values. A value greater than 150 is considered positive. Determine the hemoglobin concentration threshold at which each extraction method fails to detect the virus.
Protocol 2: Paired Clinical Sample Comparison of Extraction Methods
This protocol outlines a head-to-head comparison of two DNA extraction methods using paired clinical samples to determine which method provides a superior detection rate.
1. Reagents and Equipment:
- Clinical specimens (e.g., cervical swabs in preservation solution)
- Two nucleic acid extraction kits/methods for comparison
- Appropriate real-time PCR or genotyping test system
- Statistical analysis software (e.g., SPSS)
2. Procedure: 1. Collect and prepare clinical specimens according to standard operating procedures. For cervical swabs, ensure excess mucus is removed and cells are collected correctly [66]. 2. For each of the 639 specimens (or an appropriate sample size), split the sample and perform nucleic acid extraction using both the boiling method and the magnetic bead method simultaneously [66]. 3. Subject all extracted nucleic acids to the same downstream detection assay (e.g., Tellgenplex HPV27 DNA genotyping Test) under identical conditions [66]. 4. Record the positive and negative results for each method and for each HPV genotype if applicable. 5. Statistical Analysis: - Use the McNemar test to compare the paired detection rates. A P-value of less than 0.05 is considered statistically significant. - Calculate the Kappa value to evaluate the consistency between the two methods. A Kappa value greater than 0.75 indicates good consistency. - Create bar comparison charts to visualize the detection capabilities for each HPV subtype.
The Scientist's Toolkit: Essential Research Reagents
Table 3: Key Research Reagent Solutions for Inhibition Studies
| Reagent / Material | Function and Application in Inhibition Studies |
|---|---|
| Synthetic Nucleic Acid Standards (RNA/DNA) [67] | Used as quantification controls and internal controls to monitor PCR inhibition; especially valuable for non-culturable viruses. |
| Hemoglobin (from whole blood) [66] | A model interferent for simulating blood contamination in clinical samples and testing the anti-interference capability of extraction and amplification protocols. |
| CheLex 100 Resin [66] | A chelating resin used in simple, boiling-based nucleic acid extraction protocols; serves as a benchmark for comparing more advanced methods. |
| Magnetic Bead-Based Extraction Kits (e.g., qEx-DNA/RNA virus T183) [66] | Automated, high-throughput nucleic acid purification systems designed to improve yield, purity, and resilience to inhibitors compared to manual methods. |
| Phycoerythrin-Labeled Hybridization Beads [66] | Used in multiplex genotyping assays (e.g., Luminex xMAP technology) for the detection and differentiation of multiple viral genotypes or pathogens simultaneously. |
Workflow and Pathway Visualizations
Experimental Workflow for Inhibition Assessment
Inhibition Assessment Workflow
Mechanism of Amplification Inhibition
Amplification Inhibition Mechanism
Nucleic Acid Testing (NAT) is a molecular technique for screening blood donations to reduce the risk of transfusion-transmitted infections (TTIs) by directly detecting viral nucleic acids, thereby narrowing the diagnostic window period [68]. For screening purposes, NAT can be performed in two primary formats: Individual Donor NAT (ID-NAT), where each sample is tested separately, and Mini-Pool NAT (MP-NAT), where samples from multiple donors (e.g., 6, 8, or 16) are combined into a single pool and tested [48] [68].
The primary advantage of MP-NAT is cost-effectiveness, as it reduces the number of tests required to screen a large number of donations [68]. However, this approach introduces a fundamental analytical challenge: pooling dilution. This refers to the dilution of the viral nucleic acid from an infected specimen by the negative specimens in the pool, which can potentially reduce the concentration of the viral target below the assay's limit of detection (LOD), leading to false-negative results [48] [69]. This document explores the critical balance between the economic benefits of larger pool sizes and the associated risk of reduced analytical sensitivity due to dilution.
Quantitative Impact of Pool Size on Sensitivity
The relationship between pool size and test sensitivity is inversely proportional, primarily governed by the factor of dilution and the viral load of the infected specimen. The following table summarizes key quantitative findings from clinical studies and modeling efforts.
Table 1: Impact of Pool Size and Dilution on NAT Sensitivity
| Pool Size / Dilution Factor | Sensitivity / Detection Rate | Viral Load Context | Study/Model Type |
|---|---|---|---|
| ID-NAT (Undiluted) | 88.88% detection rate [48] | Low and high viral load samples | Clinical study (retesting in triplicate) |
| 1:6 & 1:8 Dilution (MP-NAT) | 33.33% (9/27 replicates detected) [48] | Viral load below 20 IU/mL | Clinical study (retesting in triplicate) |
| 1:6 & 1:8 Dilution (MP-NAT) | >67% of low viral load samples missed [48] | Low viral load NAT yield samples | Conclusion from clinical data |
| MP-6 NAT | May miss ~53% of low viral load HBV yield cases [48] | Low viral load HBV | Similar dilution study (South Africa) |
| MP-16 NAT | Little measurable impact on blood safety vs. ID-NAT [68] | General HIV, HCV, HBV | Analysis of American Red Cross data |
The data unequivocally demonstrates that the sensitivity loss is most pronounced for specimens with a low viral load, which are characteristic of early window period infections or occult infections [48] [69]. Specimens with a high viral load (e.g., > 50 IU/mL) are detected reliably even at 1:8 dilution, whereas those with viral loads below 20 IU/mL are frequently missed [48]. A mathematical model calibrated for the HIV ULTRIO Plus Assay confirms that pooled test sensitivity is a function of both viral load progression and the number of infected specimens in a pool, providing a framework for deriving sensitivity values for various pool sizes [69].
Experimental Protocol: Evaluating Dilution Effects
To empirically validate the sensitivity of a given NAT assay under different pooling scenarios, the following dilution study protocol can be implemented. This protocol is adapted from a published investigation into the sensitivity of the Procleix Ultrio Plus Assay [48].
Materials and Equipment
Table 2: Key Research Reagent Solutions and Materials
| Item | Function / Description | Application in Protocol |
|---|---|---|
| NAT Yield Samples | Plasma samples reactive by NAT but non-reactive by serology [48]. | Source of low viral load virus. |
| NAT-Negative Plasma | Plasma tested and confirmed negative by both serology and NAT [48]. | Matrix for creating dilutions. |
| NAT Assay Reagents | Specific reagents for the amplification/detection platform (e.g., Procleix Ultrio Plus) [48]. | Target detection and amplification. |
| Real-time PCR System | Platform for viral load quantification (e.g., COBAS Ampliprep/COBAS Taqman) [48]. | Independent viral load measurement. |
| Viral Load Standards | WHO International Standards for HIV, HBV, HCV [70]. | Assay calibration and validation. |
Methodological Procedure
- Sample Selection and Characterization: Identify and obtain NAT yield samples (e.g., reactive exclusively by a sensitive NAT assay but non-reactive by standard NAT or serology). Quantify the viral load of these samples using a validated real-time PCR method to establish a baseline [48].
- Preparation of Dilutions: For each NAT yield sample, prepare serial dilutions in NAT-negative plasma to mimic different MP-NAT pool sizes. Critical dilution factors to test include 1:2, 1:4, 1:6, and 1:8 [48].
- Testing Replicates: Test each dilution of every sample, along with the archived undiluted sample, in multiple replicates (e.g., n=3) using the NAT assay. This allows for the assessment of detection consistency and Poisson distribution effects [48].
- Data Analysis: Calculate the detection rate (number of positive replicates / total number of replicates tested) for each dilution factor. Correlate the detection rate with the baseline viral load to determine the LOD for each effective pool size.
Workflow Visualization
The following diagram illustrates the logical workflow and decision points of the experimental protocol for assessing dilution sensitivity.
Mathematical Modeling of Pooled Sensitivity
Beyond empirical studies, a mathematical methodology can be employed to derive the sensitivity of pooled testing computationally. This approach integrates models of viral load progression and pooling dilution [69].
Model Components
- Viral Load Progression Model: This model describes the concentration of the viral nucleic acid in an infected individual over time (t). It typically includes:
- A doubling time model (e.g., ( VL(t) = C_0 2^{t/\lambda} )) for the window period.
- An expanded model that captures the viral load through peak and steady-state phases beyond the window period, as sensitivity is not perfect even outside the window [69].
- Pooling Dilution Model: This model accounts for the reduction in viral concentration when an infected specimen is mixed with n-1 negative specimens. The effective concentration in the pool becomes ( VL_{pool} = VL(t) / n ).
- Dose-Response Relationship: A function (e.g., a probit function) maps the effective viral load in the pool to a probability of detection (sensitivity) for the specific NAT assay [69].
Model Integration and Calculation
The overall sensitivity of a pool of size n, Sens(n), is derived by integrating the viral load progression and the dose-response relationship, often using the law of total probability and higher-dimensional integrals. The model can be conditioned on the number of infected specimens in the pool [69]. A key output is an easy-to-compute approximation function that establishes a functional relationship between pooled test sensitivity, pool size, and the number of infected specimens in the pool.
Conceptual Framework Visualization
The following diagram outlines the logical structure of the mathematical modeling approach for estimating pooled testing sensitivity.
The choice between ID-NAT and MP-NAT, and the selection of an optimal MP-NAT pool size, is a risk-management decision that must balance economic efficiency with analytical sensitivity and blood safety.
- ID-NAT is the ideal methodology for maximizing safety by avoiding dilution, making it particularly crucial for detecting low viral load infections [48] [68].
- MP-NAT is a cost-effective alternative but requires careful selection of the pool size based on the endemic prevalence of the TTIs and the sensitivity of the available NAT assay [68].
- Empirical dilution studies and mathematical modeling are critical tools for validating the efficacy of a chosen MP-NAT protocol and for informing evidence-based blood safety policy.
Ultimately, the decision to implement NAT and the format chosen should be considered within the context of a quality-assured blood transfusion system that includes volunteer donation, sensitive serological testing, and donor notification/counseling [68].
Platform Validation and Comparative Performance Analysis
Within the framework of viral nucleic acid testing (NAT) protocols research, analytical validation serves as the cornerstone for ensuring that diagnostic methods are reliable, accurate, and fit for their intended purpose. This process is critical for closing the serological window period in blood donation screening and for the accurate diagnosis and monitoring of infectious diseases in clinical settings [71]. The implementation of NAT, primarily using real-time Polymerase Chain Reaction (PCR) technology, has significantly increased transfusion safety by enabling the direct detection of DNA and RNA molecules from infectious agents like Human Immunodeficiency Virus (HIV), Hepatitis C Virus (HCV), and Hepatitis B Virus (HBV) at an early stage of infection [11]. However, the sensitivity and specificity of these assays can vary widely between laboratories, necessitating a rigorous and standardized approach to validation [71]. This application note provides detailed methodologies and protocols for establishing key analytical performance parameters—Limit of Detection (LOD), Specificity, and Precision—for viral NAT protocols, ensuring results are comparable across different laboratories and over time.
Key Analytical Parameters
The accuracy and reliability of viral NAT results are defined by several key analytical parameters. These parameters ensure that the test performs consistently within its intended use and provide a framework for comparing different assays.
Limit of Detection (LOD)
The Limit of Detection (LOD), also referred to as the Lower Limit of Detection (LLD), is the lowest concentration of an analyte that can be consistently distinguished from a blank sample with a stated confidence level [72]. In viral NAT, it defines the minimal viral load the assay can detect, directly impacting the ability to identify infections during the early window period. A lower LOD indicates higher analytical sensitivity [73]. The LOD is a matrix, method, and analyte-specific parameter [72]. It is crucial to differentiate LOD from the Lower Limit of Quantification (LLOQ); the LOD confirms the presence of the target, while the LLOQ is the lowest concentration that can be measured with acceptable precision and accuracy for quantification [72].
Specificity
Specificity refers to the assay's ability to detect only the intended target organism without cross-reacting with non-target organisms or materials. For viral NAT, this involves ensuring that primers and probes do not anneal to genetic sequences from other viruses, commensal flora, or human DNA that may be present in the sample. High specificity is vital to avoid false-positive results, which can lead to unnecessary treatments or the erroneous discard of blood donations [11]. Comprehensive specificity testing should be performed against a panel of genetically related and unrelated pathogens that are likely to be encountered in the same clinical or donor population.
Precision
Precision describes the closeness of agreement between a series of measurements obtained from multiple sampling of the same homogeneous sample under prescribed conditions. It is a measure of the assay's reproducibility and repeatability. Precision is typically assessed at multiple levels of viral concentration (e.g., low, medium, and high) and expressed as the coefficient of variation (%CV) for the measured results. High precision ensures that the test yields consistent results across different runs, different days, different operators, and different instruments within the same laboratory, which is essential for reliable patient monitoring and donor screening [74].
Table 1: Key Analytical Parameters for Viral NAT Validation
| Parameter | Definition | Impact on Assay Performance | Common Target Value |
|---|---|---|---|
| Limit of Detection (LOD) | Lowest viral concentration reliably detected [72]. | Determines early infection sensitivity; a lower LOD shortens the diagnostic window period. | Determined empirically; typically has a ≥95% detection rate. |
| Specificity | Ability to exclusively detect the target virus. | Prevents false positives from cross-reactivity with non-target organisms. | 100% (no cross-reactivity with a panel of off-target organisms). |
| Precision | Closeness of repeated measurements (%CV) [74]. | Ensures consistent results across runs, operators, and equipment. | %CV < 30% for LLOQ and other quantitative points [72]. |
Experimental Protocols
The following sections provide detailed, step-by-step protocols for establishing LOD, specificity, and precision for a viral NAT assay.
Protocol for Establishing Limit of Detection (LOD)
The LOD protocol determines the minimal viral concentration that can be reliably detected by the assay.
3.1.1 Materials and Reagents
- WHO International Standard (IS): The primary reference material for the target virus (e.g., HIV-1 IS 16/194, HCV IS 14/150, HBV IS 10/266) [71]. These standards have a defined potency in International Units (IU), which allows for the harmonization of results across different assays [75] [71].
- Negative Sample Matrix: The biological matrix (e.g., human plasma, serum) that is confirmed to be negative for the target virus and other relevant pathogens.
- NAT Assay Reagents: The complete set of reagents for the nucleic acid testing platform, including extraction kits, amplification master mix, primers, and probes.
3.1.2 Experimental Procedure
- Serial Dilution: Prepare a series of dilutions from the WHO IS in the negative sample matrix. The dilution series should bracket the expected LOD, typically spanning a 1 to 2 log10 range.
- Sample Testing: Test each dilution level in a minimum of 20 independent replicates. The number of replicates is critical for a statistically robust determination. These replicates should be tested across different runs, by different operators, and on different days to capture total variability.
- Data Analysis: For each dilution level, calculate the proportion of replicates that tested positive. The LOD is defined as the lowest concentration at which ≥95% of the replicates return a positive result.
3.1.3 Workflow Diagram The following diagram illustrates the logical workflow for establishing the LOD.
Protocol for Establishing Specificity
This protocol verifies that the assay does not produce false-positive results with non-target organisms.
3.2.1 Materials and Reagents
- Cross-Reactivity Panel: A panel of samples containing high-titer preparations of genetically related and unrelated viruses, bacteria, and fungi. For a comprehensive HIV-1 assay, this panel should include HIV-2, HCV, HBV, HTLV, CMV, EBV, and common respiratory pathogens.
- Human Genomic DNA: To rule out non-specific amplification from human genetic material.
- Negative Controls: Confirmed negative human plasma or serum samples.
3.2.2 Experimental Procedure
- Panel Preparation: Obtain or prepare samples for each organism in the cross-reactivity panel. The concentration of each non-target organism should be at a level that challenges the assay's specificity, typically higher than what is clinically relevant.
- Testing: Test each member of the cross-reactivity panel, human genomic DNA, and negative controls in a minimum of three replicates using the standard NAT protocol.
- Analysis: A specific assay will yield negative results for all non-target organisms and the negative controls. Any positive result for a non-target sample indicates cross-reactivity and may require re-design of primers and probes.
Table 2: Example Cross-Reactivity Panel for an HIV-1 NAT Assay
| Target Virus | Non-Target Organisms for Specificity Testing | Expected Result |
|---|---|---|
| HIV-1 | HIV-2 | Negative |
| Hepatitis C Virus (HCV) | Negative | |
| Hepatitis B Virus (HBV) | Negative | |
| Human T-lymphotropic virus (HTLV-I/II) | Negative | |
| Cytomegalovirus (CMV) | Negative | |
| Epstein-Barr Virus (EBV) | Negative | |
| Human Genomic DNA | Negative |
Protocol for Establishing Precision
This protocol assesses the assay's variability under defined conditions.
3.3.1 Materials and Reagents
- Quality Control (QC) Materials: Three levels of QC materials (Low, Medium, and High viral concentration) prepared by spiking the target virus into the negative sample matrix. These materials should be aliquoted and stored at ≤ -70°C to ensure stability throughout the validation.
- NAT Assay Reagents.
3.3.2 Experimental Procedure
- Experimental Design: Test each of the three QC levels in duplicate or triplicate over at least 20 different runs. The design should incorporate major sources of variance, including different operators, different instrument calibrations, and different lots of critical reagents (e.g., extraction kits, master mix).
- Data Collection: Record the quantitative results (e.g., IU/mL) or qualitative results (e.g., Ct value) for each replicate.
- Statistical Analysis: Calculate the mean, standard deviation (SD), and coefficient of variation (%CV) for the results at each QC level. The %CV is calculated as (SD / Mean) × 100. For quantitative NAT assays, a %CV of less than 30% at the LLOQ and other levels is generally considered acceptable [72].
3.3.3 Workflow Diagram The following diagram outlines the process for a precision study incorporating repeatability and intermediate precision.
The Scientist's Toolkit: Research Reagent Solutions
The successful implementation and standardization of viral NAT rely on a set of critical reagents and materials. The table below details key components and their functions in the analytical validation process.
Table 3: Essential Research Reagents and Materials for Viral NAT Validation
| Reagent/Material | Function and Importance in Validation | Examples/Sources |
|---|---|---|
| WHO International Standards (IS) | Primary reference materials with defined potency in International Units (IU) for a specific virus. They are essential for calibrating assays, determining LOD, and ensuring results are comparable across laboratories and over time [75] [71]. | HIV-1 (IS 16/194), HCV (IS 14/150), HBV (IS 10/266), CMV (IS 09/162), ZIKV (IS) [71]. |
| Nucleic Acid Extraction Kits | Isolate and purify viral nucleic acid (DNA/RNA) from the clinical sample matrix. The efficiency and consistency of extraction directly impact assay sensitivity and LOD. | Kits based on silica membrane or magnetic bead technology. |
| Real-time PCR Master Mix | A optimized mixture containing enzymes, dNTPs, and buffers necessary for the amplification and detection of the target nucleic acid. Stable, ready-to-use reagents reduce manual handling errors and improve precision [11]. | Master mixes often include stabilizers and are provided as ready-to-use reagents [11]. |
| Primers and Probes | Short, specific nucleotide sequences that bind to the target viral genome for amplification and detection. Their design is the primary determinant of assay specificity and sensitivity. | Designed to target conserved regions of the viral genome; often used with dual-labeled probes (e.g., TaqMan). |
| Internal & External Controls | Internal Control: Monitors extraction efficiency and inhibits detection in each individual sample. External Positive Controls: Verify the entire testing process without affecting calibration [11]. | Synthetic non-target nucleic acid; Armored RNA; External Control Kit [11]. |
| Automated NAT Platforms | Integrated systems that automate sample preparation, nucleic acid amplification, and detection. They enhance throughput, reduce cross-contamination, and improve workflow efficiency and precision [11]. | cobas 6800/8800 Systems [11]. |
Nucleic acid amplification testing (NAT) represents a cornerstone of modern molecular diagnostics, offering direct detection of pathogen-specific genomic material. Within clinical virology, NAT systems are indispensable for screening transfusion-transmitted infections (TTIs) and managing infectious disease outbreaks, providing significant advantages over serological methods by detecting infections during the pre-seroconversion "window period" [7]. This application note provides a systematic comparison of the sensitivity and specificity of commercial NAT platforms, framed within the context of viral NAT protocol research. We summarize performance metrics from recent clinical evaluations and outline standardized experimental protocols to guide researchers, clinical scientists, and drug development professionals in selecting and implementing these critical diagnostic tools.
Performance Comparison of Commercial NAT Systems
NAT versus Serologic Testing for Transfusion-Transmitted Infections
A large-scale retrospective analysis comparing NAT with chemiluminescence (CLIA) for detecting major transfusion-transmitted viruses (HBV, HCV, HIV) demonstrated the superior accuracy of NAT technology. The study analyzed 87,620 specimens from voluntary blood donors across two university blood transfusion centers in Egypt [7].
Table 1: Performance Comparison of NAT versus CLIA for Viral Detection
| Virus | Testing Method | Reactive Samples | True Positives | False Positives | False Negatives | Accuracy (%) |
|---|---|---|---|---|---|---|
| HBV | CLIA | 676 | - | - | - | - |
| NAT | 621 | 589 | 87 | 32 | 99.86 | |
| HCV | CLIA | 1,477 | - | - | - | - |
| NAT | 1,328 | 1,305 | 172 | 23 | 99.78 | |
| HIV | CLIA | 22 | - | - | - | - |
| NAT | 19 | 19 | 3 | 0.0 | 100.00 |
The perfect agreement between methods, measured by Cohen's kappa, was 0.907 for HBV, 0.929 for HCV, and 0.900 for HIV, indicating excellent concordance beyond chance [7]. NAT implementation with CLIA significantly increased blood transfusion safety through direct sequence-specific detection of viral genomes, supporting the adoption of NAT technology in blood transfusion centers.
Emerging NAT Technologies: CRISPR-Based Systems
CRISPR-Cas systems have emerged as promising next-generation molecular diagnostic tools with high specificity, rapid detection, and ease of use [76]. Unlike traditional NAT methods, CRISPR diagnostics leverage the trans-cleavage activities of Cas12 and Cas13 proteins after they complex with guide RNA and target nucleic acids.
Table 2: Comparison of Traditional and CRISPR-Based NAT Platforms
| Platform Type | Example Systems | Key Features | Sensitivity | Specificity | Limitations |
|---|---|---|---|---|---|
| Traditional NAT | Cobas 6800/8800 (Roche), Procleix Ultrio (Gen-Probe) | Fully automated, multiplex capability | High | High | Requires specialized infrastructure, higher cost |
| CRISPR-Dx | HOLMES, HOLMESv2, DETECTR, SHERLOCK | High specificity, simple operation, multiple signal readouts | aM level | Single-base discrimination | Early commercialization stage |
The HOLMESv2 platform, utilizing Cas12b, represents the first one-step CRISPR detection system that combines LAMP amplification with CRISPR detection in a single tube, eliminating the need for post-amplification manipulation and reducing aerosol contamination risk [76]. This integration achieves attomolar (aM) sensitivity while maintaining the ability to distinguish single-base differences.
Experimental Protocols for NAT Evaluation
Sample Collection and Processing
Materials:
- Venous blood collection tubes (EDTA)
- Viral transport medium for swab samples
- Centrifuge capable of 1300 × g
- Pipettes and sterile tips
- Nuclease-free microcentrifuge tubes
Procedure:
- Collect venous blood in EDTA tubes or nasopharyngeal swabs in viral transport medium
- Process blood samples within 6 hours of collection
- Centrifuge blood samples at 1300 × g for 15 minutes to separate plasma
- Aliquot plasma/sample material into nuclease-free tubes
- Store samples at -80°C if not testing immediately
Nucleic Acid Extraction
Materials:
- Commercial nucleic acid extraction kits (e.g., Loccus Biotecnologia Viral RNA and DNA Kit)
- Automated nucleic acid extractor (e.g., Extracta 32)
- Nuclease-free water
- 100% ethanol
Procedure:
- Follow manufacturer's instructions for the specific extraction kit
- For automated extraction: Program the instrument according to manufacturer's protocols
- Elute nucleic acids in 50-100 µL of provided elution buffer
- Quantify nucleic acid concentration using spectrophotometry if needed
- Store extracted nucleic acids at -80°C or proceed immediately to amplification
Nucleic Acid Amplification and Detection
Materials:
- Commercial NAT kits (e.g., Cobas MPX test, Procleix Ultrio assay)
- Real-time PCR instruments
- Appropriate primers and probes
- Reaction plates or tubes
Procedure for Multiplex NAT (e.g., Cobas MPX):
- Prepare master mix according to manufacturer's instructions
- Add extracted nucleic acid templates to reaction vessels
- Load vessels into the automated system
- Run the pre-programmed amplification protocol
- Review results automatically assigned by system software as non-reactive, reactive, or invalid
Procedure for CRISPR-Based Detection (e.g., HOLMESv2):
- Prepare LAMP master mix for target amplification
- Add Cas12b enzyme, guide RNA, and ssDNA reporter probe
- Incubate at constant temperature (61°C) for 60 minutes
- Measure fluorescence output or use lateral flow readout
- For quantitative analysis, include standard curves of known concentration
NAT Workflow and Signaling Pathways
NAT Experimental Workflow
CRISPR-Cas Diagnostic Signaling Pathway
The Scientist's Toolkit: Essential Research Reagents
Table 3: Essential Reagents for NAT Research and Development
| Reagent/Material | Function | Example Products/Formats |
|---|---|---|
| Nucleic Acid Extraction Kits | Isolation and purification of viral NA from clinical samples | Loccus Biotecnologia Viral RNA and DNA Kit, QIAamp Viral RNA Mini Kit |
| PCR Master Mixes | Amplification of target sequences with necessary enzymes and buffers | GoTaq Probe 1-Step RT-qPCR System, TaqMan Fast Virus 1-Step Master Mix |
| CRISPR-Cas Components | Sequence-specific detection and signal amplification | Cas12a, Cas12b, Cas13a proteins; crRNA; ssDNA/RNA reporters |
| Primers and Probes | Target-specific recognition and amplification | Custom DNA oligonucleotides, dual-labeled fluorescent probes |
| Positive Controls | Verification of assay performance and sensitivity | Synthetic RNA/DNA controls, inactivated viral cultures |
| Internal Controls | Monitoring extraction efficiency and inhibition | MS2 phage, RNase P, synthetic exogenous controls |
| Enzymes for Isothermal Amplification | Nucleic acid amplification at constant temperature | Bst DNA polymerase, reverse transcriptase for LAMP/RPA |
| Signal Detection Reagents | Generation of measurable output | Fluorescent substrates, lateral flow strips, colorimetric reagents |
Commercial NAT systems demonstrate exceptional clinical performance with accuracy exceeding 99.7% for major transfusion-transmitted viruses, significantly reducing false-positive and false-negative results compared to serological methods alone [7]. The implementation of NAT alongside serological testing provides a multi-layered safety approach for blood transfusion services, effectively minimizing the risk of transfusion-transmitted infections. Emerging CRISPR-based NAT platforms offer promising alternatives with high sensitivity, specificity, and potential for point-of-care applications, though they require further validation in clinical settings [76]. The standardized protocols presented herein provide researchers with robust methodologies for evaluating these systems, contributing to the ongoing advancement of viral nucleic acid testing protocols and ensuring the highest standards of diagnostic accuracy in clinical practice.
The accurate detection of Severe Acute Respiratory Syndrome Coronavirus 2 (SARS-CoV-2) through reverse transcription quantitative polymerase chain reaction (RT-qPCR) remains fundamental to diagnostic microbiology, epidemiological surveillance, and therapeutic development. The choice of viral target genes in molecular assays critically influences diagnostic sensitivity, specificity, and the potential for variant-associated test failures. This application note provides a systematic comparative analysis of three principal genetic targets—ORF1ab, N-gene, and E-gene—evaluating their relative sensitivities and performance characteristics across commercially available RT-qPCR assays. The optimization of viral nucleic acid testing (NAT) protocols depends on understanding these performance differentials, which is particularly crucial for researchers and drug development professionals designing diagnostic strategies and evaluating antiviral therapeutics.
Comparative Sensitivity Analysis of SARS-CoV-2 Target Genes
The analytical and clinical sensitivities of SARS-CoV-2 RT-qPCR assays are influenced significantly by the target gene, primer/probe design, and viral variants. The following synthesis provides a data-driven comparison to guide assay selection.
Table 1: Comparative Analytical Sensitivity of SARS-CoV-2 Target Genes Across Commercial Assays
| Target Gene | Representative Assays | Limit of Detection (Copies/mL) | Relative Clinical Sensitivity | Variant Sensitivity Notes |
|---|---|---|---|---|
| ORF1ab | TaqPath COVID-19 CE-IVD, U-TOP COVID-19, ƩS COVID-19 | 1.0 - 1,835 copies/reaction [77] [78] | High; Often the most sensitive single target [78] | Highly conserved; less prone to dropout from variant mutations [78] |
| N-gene | Allplex SARS-CoV-2/FluA/FluB/RSV, Sansure Biotech, GeneFinder, ƩS COVID-19 | 1.0 - 1,300 copies/mL [77] [78] | High; Performance can be kit-dependent [79] [78] | Highly expressed; sensitive target but some variants have implicated mutations [80] [78] |
| E-gene | Standard M nCoV, U-TOP COVID-19, WHO recommended protocol | 650 - 1,300 copies/mL [78] | Moderate to High; Excellent for screening [78] | Highly conserved; good screening target, used in WHO protocols [78] |
The ORF1ab gene, which encodes viral replicase components, frequently demonstrates superior analytical sensitivity. A 2024 study developing the ƩS COVID-19 assay reported a limit of detection (LoD) of 1.835 copies/reaction for ORF1ab, compared to 1 copy/reaction for the N-gene in the same assay [77]. Conversely, a 2022 performance evaluation found that the S and ORF1ab genes were the most sensitive targets in the U-TOP COVID-19 detection kit [78]. This suggests that while intrinsic gene properties matter, primer and probe design are equally critical in determining the final LoD of an assay [78].
The N-gene is a structurally abundant protein, making its corresponding RNA a target with high potential sensitivity. In a 2021 kit comparison, the Sansure Biotech kit, which targets ORF1ab and N-gene, showed a slightly better diagnostic performance compared to other kits [79]. Furthermore, a 2025 study on viral kinetics reported that the N-gene consistently yielded lower Ct values (indicating higher viral load) than the ORF1ab gene across multiple SARS-CoV-2 variants, including B.1, BA.2, and BA.5 [80].
The E-gene is a highly conserved region, making it an excellent target for broad-spectrum detection of SARS-CoV-2 and related betacoronaviruses. It is a cornerstone of the WHO's initial recommended testing protocol [78]. However, its sensitivity can be marginally lower than other targets; in the Standard M nCoV real-time detection kit, the RdRp (part of ORF1ab) target demonstrated higher clinical sensitivity than the E-gene [78].
Table 2: Dynamic Ct Values of N and ORF1ab Genes Across SARS-CoV-2 Variants
| Variant | Median ORF1ab Ct Value | Median N-gene Ct Value | Interpretation (Viral Load) |
|---|---|---|---|
| B.1 (Ancestral) | 31.37 [80] | 30.49 [80] | Lowest Ct values, indicating highest viral load |
| BA.2 (Omicron) | 33.00 [80] | 32.00 [80] | Highest Ct values, indicating lowest viral load |
| BA.5 (Omicron) | Data not specified | Data not specified | Intermediate Ct values between B.1 and BA.2 |
The emergence of SARS-CoV-2 variants has underscored the importance of multi-target design. While the E, N, and ORF1ab genes are generally well-conserved, mutations have been documented in all [78]. For instance, certain variants have shown mutations in the N-gene that can potentially affect assay performance [78]. The ORF1ab gene is often considered highly conserved, making it a reliable target with less susceptibility to variant-induced test failures [78]. The selection of a single target is inherently risky for broad variant detection; thus, modern FDA-authorized assays typically target at least two conserved genomic regions to mitigate the risk of false negatives due to viral evolution.
Experimental Protocol for Comparative Assay Evaluation
This protocol outlines a standardized procedure for comparing the sensitivity and specificity of different SARS-CoV-2 target genes (ORF1ab, N, E) using multiple commercial RT-qPCR assays.
Materials and Equipment
- Clinical Specimens: Archived, de-identified nasopharyngeal swab (NPS) samples stored at -70°C or below, with known positive, negative, and borderline Ct values [79] [78].
- Commercial RT-qPCR Kits: Select kits with different target combinations (e.g., Allplex [S, RdRp, N], Standard M nCoV [E, RdRp], U-TOP [ORF1ab, N, S, E]) [78].
- RNA Extraction Kit: Viral RNA extraction kit such as the MGI Easy Nucleic Acid Extraction Kit [81] or equivalent.
- Automated Extraction System: e.g., MGISP-960 or Microlab STARlet [81] [78].
- Real-time PCR Instrument: CFX96 System (Bio-Rad) or QuantStudio 5 (Thermo Fisher) [79] [78].
- QC Materials: External RNA controls, including variants of concern (e.g., B.1.351) [78].
Procedure
Sample Preparation and RNA Extraction
- Thaw clinical samples and controls on ice. Vortex briefly and centrifuge at low speed to collect contents [79].
- Extract total viral RNA from a 200 µL input volume of each NPS sample using an automated nucleic acid extraction system, following the manufacturer's instructions. Elute RNA in 30-50 µL of nuclease-free water [81] [78].
- Quantify and assess the purity of RNA using a spectrophotometer (e.g., Nanodrop). Accept 260/280 ratios between 1.8-2.1.
RT-qPCR Setup and Amplification
- For each commercial kit being evaluated, prepare master mixes strictly according to the manufacturer's instructions.
- Pipette appropriate volumes of master mix into individual PCR wells or strips.
- Add a standardized volume of extracted RNA (e.g., 5-10 µL, as specified by the kit) to each reaction. Each sample should be tested across all kits in parallel from the same RNA eluate to minimize preparation bias [79].
- Include negative (nuclease-free water) and positive (kit-provided or validated external control) controls in each run.
- Seal the plate and perform amplification on a real-time PCR instrument using the thermal cycling conditions specified by each manufacturer. The following parameters are typical:
Data Analysis
- Analyze the amplification curves using the instrument's software. Manually set the fluorescence threshold within the exponential phase of amplification for all assays to ensure consistent Ct value determination [79].
- Record Ct values for each target gene in every sample.
- For sensitivity calculations, use a pre-defined reference standard (e.g., consensus result from multiple kits or a reference method) to classify true positives and negatives [78].
- Calculate the sensitivity and specificity for each target gene and kit combination. Perform statistical analysis (e.g., ANOVA) to compare mean Ct values across kits for the same sample and gene target [79].
Figure 1: Experimental workflow for comparative evaluation of SARS-CoV-2 target gene assays, from sample collection to data analysis.
The Scientist's Toolkit: Research Reagent Solutions
The reliable performance of SARS-CoV-2 NAT protocols depends on a suite of critical reagents and controls. The following table details essential materials for assay development and validation.
Table 3: Essential Research Reagents for SARS-CoV-2 Assay Development
| Reagent / Material | Function / Application | Exemplars / Specifications |
|---|---|---|
| Commercial RT-qPCR Kits | Qualitative detection of SARS-CoV-2 RNA via specific gene targets | Allplex (S, RdRp, N), Standard M nCoV (E, RdRp), U-TOP (ORF1ab, N, S, E), TaqPath (ORF1ab, N, S) [78] |
| RNA Extraction Kits | Isolation of high-quality viral RNA from clinical matrices | MGI Easy Nucleic Acid Extraction Kit, Viral DNA/RNA Extraction Kit (ALPHAGENE) [79] [81] |
| RNA Controls | Assay calibration, LoD determination, and QC for variant sensitivity | Amplirun SARS-CoV-2 RNA Control (Vircell), SARS-CoV-2 B.1.351 RNA Control for variant testing [78] |
| Internal Control | Monitoring RNA extraction integrity and PCR inhibition | RNase P (human gene), Avocado sunblotch viroid (ASBVd), MS2 Phage [79] [77] |
The strategic selection of SARS-CoV-2 target genes is a critical determinant in the design of robust NAT protocols. Evidence consistently shows that the ORF1ab and N genes frequently offer the highest analytical and clinical sensitivity, while the E-gene provides a highly conserved target suitable for broad screening. However, the primer and probe design of a given commercial kit can be as influential as the choice of target gene itself. The dynamic nature of viral evolution necessitates a multi-target approach to ensure diagnostic accuracy against emerging variants. The experimental framework and data summarized in this application note provide a foundation for researchers and drug development professionals to make informed decisions in assay selection, optimization, and development, ultimately strengthening viral surveillance and therapeutic evaluation efforts.
Viral Nucleic Acid Testing (NAT) represents a critical methodology for detecting, quantifying, and monitoring viral pathogens in clinical and research settings. The development and implementation of these assays require rigorous validation and compliance with established regulatory frameworks to ensure safety, efficacy, and reliability. Two predominant systems govern the market authorization of in vitro diagnostic devices (IVDs), including viral NAT: the United States Food and Drug Administration (FDA) and the European Union's CE marking system under the In Vitro Diagnostic Regulation (IVDR) [82]. For researchers and drug development professionals, understanding the distinct requirements, pathways, and timelines of these systems is paramount for strategic planning and successful global market entry.
This application note provides a comparative analysis of the FDA and CE marking regulatory requirements, detailed experimental protocols for assay validation, and essential tools for compliance. The objective is to equip scientists with the practical knowledge necessary to navigate these complex regulatory landscapes efficiently, thereby accelerating the translation of viral NAT research from the laboratory to clinical application.
Comparative Analysis: FDA vs. CE Marking Pathways
The regulatory philosophies and processes of the FDA and the EU MDR/IVDR systems exhibit fundamental differences that significantly impact development strategies [83]. The table below summarizes the core quantitative and qualitative distinctions relevant to viral NAT development.
Table 1: Strategic Comparison of FDA and CE Marking Pathways for Viral NAT
| Parameter | U.S. FDA Pathway | EU CE Marking (MDR/IVDR) Pathway |
|---|---|---|
| Governing Authority | Centralized (FDA) [82] | Decentralized (Notified Bodies in member states) [82] |
| Core Philosophy | Predicate-based (for 510(k)) or risk-based PMA [82] | Performance-based, conformity with General Safety & Performance Requirements (GSPRs) [82] |
| Typical Timeline | 6-12 months for 510(k) [82] | 12-18 months for CE Mark [82] |
| Estimated Cost | $1M - $6M for 510(k) [82] | $500K - $2M for CE Mark [82] |
| Clinical Evidence | May not be required for 510(k) if substantial equivalence to a predicate is shown via performance testing [82] | Clinical evaluation report (CER) mandatory for all devices; often requires clinical data [82] |
| Quality System | 21 CFR 820 (transitioning to ISO 13485:2016 via QMSR in 2026) [82] | ISO 13485:2016 compliance mandatory [82] |
| Post-Market Surveillance | Medical Device Reporting (MDR) for adverse events [82] | Vigilance reporting, Post-Market Clinical Follow-up (PMCF), and Periodic Safety Update Reports (PSUR) [82] |
| Global Recognition | Primarily for U.S. market access [82] | Access to EEA (EU-27 + Iceland, Liechtenstein, Norway) and broader global recognition [82] |
Key Implications for Viral NAT Developers
- Classification Drives Strategy: The same viral NAT may be classified differently under each system. For instance, quantitative HBV nucleic acid-based assays have been reclassified from FDA Class III to Class II, subject to special controls, simplifying their pathway [84]. Under EU IVDR, the same assay would be classified based on its intended use and associated risk.
- Strategic Sequencing: Companies often pursue both markets sequentially. Beginning with the CE Mark can provide faster revenue generation and broader initial market access, which can fund the typically more resource-intensive FDA submission. Conversely, starting with the FDA can provide high regulatory credibility that facilitates subsequent international approvals [82].
- Clinical Data Planning: The EU's mandatory clinical evaluation necessitates a more robust and earlier clinical data generation strategy compared to the FDA's 510(k) pathway, where a predicate device may allow for a primarily analytical performance-based submission [82].
Experimental Protocols for Viral NAT Validation
The following protocols outline the core experiments required to generate the analytical performance data needed for regulatory submissions to both the FDA and EU Notified Bodies. These are based on best practices and regulatory guidance for assays such as the Alinity m HIV-1 assay [85] and other nucleic acid-based tests [86].
Protocol: Determination of Limit of Detection (LoD)
Objective: To establish the lowest concentration of the viral target that can be consistently detected in a specified sample matrix with ≥95% probability.
Materials:
- Synthetic oligonucleotides or viral lysate with known concentration
- Negative sample matrix (e.g., human plasma, serum)
- NAT reagent kit (e.g., primers, probes, master mix)
- Real-time PCR instrument
Methodology:
- Sample Preparation: Serially dilute the viral target in the negative sample matrix to concentrations spanning the expected LoD.
- Replication: Test each dilution level in a minimum of 20 replicates across multiple days and by multiple operators to account for variability.
- Testing: Run all samples through the complete NAT workflow, including extraction (if part of the protocol) and amplification.
- Data Analysis:
- Record the proportion of positive results at each concentration level.
- Use a statistical model (e.g., probit analysis) to determine the concentration at which 95% of the replicates test positive.
- Report this value as the verified LoD.
Protocol: Linearity and Quantitative Range
Objective: To verify that the assay provides results that are directly proportional to the true concentration of the analyte across the claimed measuring range.
Materials:
- High-titer viral stock with known concentration
- Negative sample matrix
- NAT reagent kit and quantitative standard(s)
Methodology:
- Sample Preparation: Create a series of at least 5 concentrations spanning the entire claimed range of the assay (e.g., from LoD to the upper limit of quantification).
- Replication: Test each concentration in triplicate.
- Testing: Analyze all samples in a single run to minimize inter-assay variation.
- Data Analysis:
- Plot the measured concentration (log10) against the expected concentration (log10).
- Perform linear regression analysis.
- The assay is considered linear if the coefficient of determination (R²) is ≥ 0.98 and the slope is between 0.9 and 1.1.
The experimental workflow for the comprehensive validation of a viral NAT is a multi-stage process, as summarized below.
The Scientist's Toolkit: Essential Research Reagent Solutions
Successful development and validation of a viral NAT require a suite of critical reagents and materials. The following table details key components and their functions in the experimental workflow.
Table 2: Essential Reagents and Materials for Viral NAT Development
| Reagent/Material | Function | Examples & Specifications |
|---|---|---|
| Primers & Probes | Specifically hybridize to and amplify target viral nucleic acid sequences. | Sequence-specific oligonucleotides; dual-labeled probes (e.g., FAM/BHQ1) for qPCR; designed against conserved regions of the viral genome. |
| Enzyme Master Mix | Catalyzes the reverse transcription and amplification reactions. | Contains reverse transcriptase, thermostable DNA polymerase, dNTPs, and buffer; e.g., one-step RT-qPCR master mixes. |
| Quantified Standards | Calibrate the quantitative assay and generate the standard curve. | Synthetic RNA transcripts or viral particles with known concentration (e.g., copies/mL); traceable to an international standard. |
| Internal Control | Monitors nucleic acid extraction efficiency and identifies PCR inhibition. | Non-interfering synthetic RNA/DNA added to each sample lysis buffer; detected in a separate fluorescent channel from the viral target. |
| Positive Controls | Verify the correct performance of the assay. | Specimens with known positivity for the target virus, typically at low and high concentrations. |
| Negative Controls | Identify contamination or non-specific amplification. | Matrix-matched samples confirmed negative for the target virus. |
| Sample Collection & Storage | Maintain integrity of viral nucleic acid from collection to analysis. | Specimen collection tubes (e.g., nasopharyngeal swabs in viral transport media [87], blood collection tubes with cell-stabilizing reagents [86]). |
Navigating the regulatory landscapes of the FDA and CE marking is a complex but manageable component of viral NAT development. A strategic approach, informed by a clear understanding of the comparative requirements outlined in this document, is crucial for efficient global market access. By integrating regulatory considerations early in the development process and employing rigorous, well-documented experimental protocols, researchers and developers can significantly de-risk their projects. Adherence to robust quality management systems, such as ISO 13485, not only fulfills regulatory mandates but also fosters a culture of quality that underpins the development of reliable and effective diagnostic tools for viral diseases.
External Quality Assessment (EQA), also known as proficiency testing (PT), serves as a critical component in the quality management system of molecular diagnostics laboratories. For viral nucleic acid testing (NAT), EQA provides an independent, systematic method to evaluate laboratory proficiency, identify discrepancies, and promote continual improvement in diagnostic performance [88]. The precision of PCR and other NAT technologies depends on multiple technical factors including sample integrity, reagent quality, assay design, instrumentation, and operator expertise [88]. EQA programs address these variables by distributing standardized samples to participating laboratories, who test these samples using their routine protocols and report results back to the provider for evaluation against reference values and peer performance [88].
In the context of viral pathogen detection, EQA is particularly crucial for maintaining assay reproducibility across different testing platforms and laboratories. Molecular diagnostics for viruses such as HBV, HCV, and HIV require exceptional sensitivity and specificity, as results directly inform critical treatment decisions and public health interventions [89] [41]. The implementation of EQA programs for nucleic acid quantitative detection has demonstrated significant improvements in laboratory performance, as evidenced by a 16-year study showing accuracy rates for HBV-DNA EQA improving from 85.37% to 98.18% [89]. This underscores the vital role of EQA in standardizing molecular diagnostics and ensuring reliable patient results across testing facilities.
EQA Implementation Framework
Establishing the EQA Framework and Objectives
Before implementing an EQA program, laboratories must define clear objectives aligned with their clinical and research priorities. Typical goals include verifying analytical sensitivity and specificity of NAT assays, ensuring inter-laboratory reproducibility, monitoring operator competence and instrument performance, and meeting accreditation requirements such as those set by CLIA or ISO 15189 [88]. The World Health Organization emphasizes the importance of integrating EQA as part of a comprehensive laboratory quality management system. EQA programs for NAT should be designed to evaluate performance across different assay types, including qualitative tests for pathogen presence/absence, quantitative viral load measurements, and multiplex panels detecting multiple targets [88].
Stepwise Implementation Protocol
Implementing a robust EQA program requires a systematic approach with careful attention to each step of the process. The following workflow outlines the key stages from provider selection to corrective actions:
Selecting an EQA Provider: Laboratories should choose providers accredited to international standards such as ISO/IEC 17043:2023 [89] [90]. Selection criteria should include the provider's experience with molecular diagnostics, availability of NAT-specific schemes relevant to the laboratory's test menu, sample matrix compatibility, and support services such as detailed performance reports and corrective action guidance [88]. Leading providers include the College of American Pathologists (CAP) and other organizations offering specialized programs for viral NAT [90].
Sample Handling and Testing: EQA samples should be treated identically to patient specimens throughout the testing process. Upon receipt, laboratories must verify sample integrity and store samples according to provider instructions, typically at recommended temperatures to maintain nucleic acid stability [88]. Testing should follow validated Standard Operating Procedures (SOPs) for nucleic acid extraction and amplification, using the same workflows, reagents, and instrumentation employed for clinical samples [88]. Detailed documentation of the entire testing process is essential, including any deviations from standard protocols.
Result Analysis and Corrective Actions: After submitting results to the EQA provider, laboratories receive performance reports comparing their results to target values and peer laboratories. When discrepancies arise, laboratories must conduct root cause analysis to investigate potential sources such as reagent quality, instrumentation errors, or operator technique [88]. Based on findings, appropriate corrective actions should be implemented, which may include personnel retraining, reagent lot validation, instrument recalibration, or SOP revisions. All investigations and corrective measures must be thoroughly documented for continuous quality improvement and accreditation readiness [88].
Quantitative Assessment of EQA Performance
Performance Metrics and Data Analysis
The quantitative evaluation of EQA results requires standardized statistical approaches to ensure consistent assessment across participating laboratories. For quantitative NAT, results are typically transformed to log10 values before analysis. The target value for each sample is determined as the robust mean when the number of participating laboratories is ≥18, or as the mean after removing outliers using Dixon's test for smaller cohorts (2 ≤ n < 18) [89]. Performance is scored based on the degree of deviation from the target value, with results considered correct when the absolute deviation is ≤0.4 log10 IU/mL [89]. Each correct result is typically awarded 20 points, with a maximum score of 100 points per round (based on five samples). Results are categorized as "optimal" (100 points), "acceptable" (80 points), or "improvable" (score <80 points) [89].
Longitudinal Performance Data
Long-term EQA program data demonstrates significant improvements in laboratory performance over time. The table below summarizes key metrics from a 16-year EQA program for HBV-DNA and HCV-RNA testing:
Table 1: Performance Metrics from a 16-Year EQA Program for Viral NAT
| Parameter | HBV-DNA EQA | HCV-RNA EQA |
|---|---|---|
| Participation Period | 2009-2024 | 2014-2024 |
| Initial Participant Count | 45 laboratories | 7 laboratories |
| Final Participant Count | 110 laboratories | 30 laboratories |
| Participation Growth | 144.44% increase | 328.57% increase |
| Initial Accuracy Rate | 85.37% (2009) | 66.67% (2014) |
| Final Accuracy Rate | 98.18% (2024) | 96.67% (2024) |
| Total Samples Processed | 9,350 samples | 1,530 samples |
| Statistical Method | Robust mean for n≥18, mean after outlier removal for n<18 | Same approach as HBV-DNA EQA |
| Acceptability Criterion | ≤0.4 log10 IU/mL deviation from target | ≤0.4 log10 IU/mL deviation from target |
Data obtained from [89]
The data demonstrates remarkable improvements in both participation and accuracy over the program duration. The exceptional growth in HCV-RNA EQA participation (328.57%) reflects increasing recognition of the importance of quality assurance in molecular diagnostics. More importantly, the accuracy rates for both HBV-DNA and HCV-RNA testing showed substantial improvement, highlighting the educational value of continuous EQA participation [89]. The reproducibility of testing was generally satisfactory across participating laboratories, though certain laboratories exhibited significant bias in detecting low- and high-concentration samples, indicating areas for focused improvement [89].
Experimental Protocols for EQA in Viral NAT
Sample Preparation and Validation
EQA programs for viral NAT require meticulous sample preparation to ensure reliable assessment of laboratory performance. The recommended protocol involves:
Sample Sourcing and Preparation: EQA panels should be sourced from certified manufacturers of national reference materials for HBV-DNA and HCV-RNA [89]. These materials must be thoroughly validated against international standards (e.g., NIBSC code: 97/750 and 06/100) using highly specific, precise, and sensitive detection reagents from reputable manufacturers [89]. Samples should be immediately stored at -20°C after preparation to maintain nucleic acid stability.
Homogeneity and Stability Testing: The homogeneity of EQA samples is evaluated by randomly selecting ten samples from each batch and testing them in duplicate using validated detection systems [89]. Stability is assessed by subjecting three sets of six samples to varying temperature conditions: room temperature for 4 hours, 4°C for 24 hours, and -20°C for one month [89]. No statistically significant differences should be observed between these conditions (p > 0.05), confirming sample integrity throughout the distribution and testing process [89].
Sample Distribution: EQA programs typically distribute panels containing five samples (three or four positive samples at different concentrations and one or two negative samples) to participating laboratories [89]. These panels are distributed in a cold chain by courier service, accompanied by detailed instructions regarding storage conditions, testing timelines, and reporting requirements.
Testing and Evaluation Protocol
The testing phase requires strict adherence to standardized procedures to ensure meaningful inter-laboratory comparisons:
Sample Processing: Participating laboratories must process EQA samples following their routine clinical testing protocols, including nucleic acid extraction, amplification, and detection steps [88]. Any deviations from standard operating procedures must be documented. The entire testing process should be performed by regular laboratory staff without special treatment of EQA samples compared to patient specimens [88].
Data Analysis and Interpretation: For quantitative NAT, reported results in International Units (IU) are first transformed into log10 values before analysis [89]. Statistical analysis includes calculation of mean (M), standard deviation (SD), robust coefficient of variation (Robust CV), and bias for each positive sample [89]. These parameters are used to evaluate both individual laboratory performance and overall program trends. Comparative analysis between different reagent systems and instrumentation platforms helps identify method-specific biases or performance issues [89].
Performance Evaluation: Laboratory performance is evaluated based on the degree of deviation from the target value, with correct results typically defined as those within ±0.4 log10 IU/mL of the target [89]. This criterion accounts for the expected technical variation in molecular quantification methods while identifying clinically significant deviations.
Research Reagent Solutions for Viral NAT
The implementation of reliable NAT protocols requires specific high-quality reagents and materials. The following table details essential research reagent solutions and their functions in viral nucleic acid testing:
Table 2: Essential Research Reagent Solutions for Viral Nucleic Acid Testing
| Reagent/Material | Function | Specifications |
|---|---|---|
| Certified Reference Materials | Provides standardized targets for quantification and quality control | Sourced from certified providers (e.g., National Certified Reference Material); validated against international standards (NIBSC) [89] |
| Nucleic Acid Extraction Kits | Isolates viral DNA/RNA from clinical samples | High purity and yield; efficient removal of inhibitors; compatible with downstream applications [88] |
| PCR Master Mixes | Provides essential components for amplification | Contains DNA polymerase, dNTPs, buffers; optimized for sensitivity and specificity; may include UNG contamination control [89] |
| Quantitative Standards | Enables calibration and quantification of viral load | Traceable to international standards; covers clinically relevant linear range; validated for specific assays [89] |
| Positive Controls | Monitors assay performance and inhibition | Characterized viral isolates or synthetic constructs; includes low-positive controls near clinical decision points [88] |
| Negative Controls | Detects contamination or non-specific amplification | Nuclease-free water or negative human plasma; confirms absence of contamination in reagents and processes [89] |
| Internal Controls | Identifies inhibition and monitors extraction efficiency | Non-competitive or competitive designs; distinguishable from wild-type target; added to each specimen [88] |
Troubleshooting and Technical Challenges
Common Technical Issues and Solutions
Despite careful implementation, laboratories may encounter technical challenges during EQA participation. The following diagram illustrates a systematic approach to troubleshooting common issues in viral NAT:
Addressing False Negative Results: False negatives in EQA samples may result from nucleic acid degradation during transport or storage, inhibition of amplification, or primer/probe mismatches with viral variants [88]. Solutions include verifying sample storage conditions upon receipt, implementing internal controls to detect inhibition, and regularly updating assay designs to account for circulating strains [88]. For low-concentration samples, which often present challenges, laboratories should optimize extraction protocols and consider concentrating samples when appropriate [89].
Addressing False Positive Results: False positives typically arise from amplicon contamination or assay cross-reactivity [88]. Preventive measures include physical separation of pre- and post-amplification areas, use of UNG contamination control systems, rigorous cleaning protocols, and thorough validation of assay specificity against closely related pathogens [88]. Regular environmental monitoring for contamination can help identify issues before they affect patient results.
Addressing Quantification Bias: Systematic biases in quantification, particularly at low and high concentration levels, may indicate issues with calibration curves, standard concentrations, or assay linearity [89]. Troubleshooting should include verification of standard traceability, assessment of calibration curve fit across the reportable range, and evaluation of pipetting accuracy for standard preparation. For extreme concentrations, method comparison with reference technologies may be necessary to identify platform-specific biases [89].
Integration with Quality Management Systems
EQA should not function as an isolated activity but rather as an integral component of a comprehensive Laboratory Quality Management System (QMS) [88]. Effective integration involves correlating EQA findings with internal quality control trends, patient data, and other quality indicators. The Centers for Disease Control and Prevention (CDC) Laboratory Quality Management System provides frameworks for structured problem-solving and continuous quality improvement [88]. Documentation of EQA participation, performance, investigations, and corrective actions provides essential evidence during accreditation assessments and demonstrates commitment to quality patient testing [88].
Conclusion
Viral Nucleic Acid Testing stands as a cornerstone of modern molecular diagnostics, offering unparalleled sensitivity and specificity for pathogen detection. The key takeaways highlight its indispensable role in blood safety, where it significantly reduces the risk of transfusion-transmitted infections, and in clinical diagnostics, where it enables early and accurate detection. The choice between methodological approaches, such as ID-NAT versus MP-NAT, must be informed by the prevalence of the target virus and required sensitivity. Future directions will be shaped by technological advancements, including the integration of CRISPR-based technologies, increased automation, and the development of portable, point-of-care devices. For biomedical research, the ongoing challenge lies in standardizing protocols, managing costs for wider implementation, and adapting assays to detect emerging viral variants, thereby solidifying NAT's critical role in public health and therapeutic development.
References
- 1. Nucleic acid test - Wikipedia [https://en.wikipedia.org/wiki/Nucleic_acid_test]
- 2. 10 Common Techniques For Nucleic Acid Research [https://www.goldbio.com/blogs/articles/10-techniques-nucleic-acid-research?srsltid=AfmBOoqjmPvpBMjue4Lai_LbW3f7x872iLYmaWYqFW3wh5T5IL5c_i3L]
- 3. Next-Generation Nucleic Acid-Based Diagnostics for Viral ... [https://pmc.ncbi.nlm.nih.gov/articles/PMC12388196/]
- 4. Quantitative comparison of SARS-CoV-2 nucleic acid ... [https://pmc.ncbi.nlm.nih.gov/articles/PMC8756411/]
- 5. Quantitative comparison of SARS-CoV-2 nucleic acid ... [https://bmcpublichealth.biomedcentral.com/articles/10.1186/s12889-021-12489-8]
- 6. Two new federal policies impacting research with synthetic ... [https://www.ehs.washington.edu/about/latest-news/two-new-federal-policies-impacting-research-synthetic-nucleic-acids-and]
- 7. A comparative analysis between NAT and ... [https://www.nature.com/articles/s41598-025-03506-6]
- 8. History and Future of Nucleic Acid Amplification ... [https://pmc.ncbi.nlm.nih.gov/articles/PMC6514489/]
- 9. Characteristic of HBV nucleic acid amplification testing yields ... [https://bmcinfectdis.biomedcentral.com/articles/10.1186/s12879-021-06468-y]
- 10. Analysis of blood screening strategies and their efficacy ... [https://pmc.ncbi.nlm.nih.gov/articles/PMC12370127/]
- 11. Nucleic acid testing (NAT) [https://diagnostics.roche.com/global/en/products/product-category/lab-type/blood-screening/nucleic-acid-nat-testing.html]
- 12. Early infant diagnosis: a pillar in preventing mother-to-child ... [https://pmc.ncbi.nlm.nih.gov/articles/PMC12577964/]
- 13. Nucleic Acid Amplification Testing for Human ... [https://pmc.ncbi.nlm.nih.gov/articles/PMC11830125/]
- 14. Nucleic acid testing identifies high prevalence of blood borne ... [https://journals.plos.org/plosone/article?id=10.1371/journal.pone.0267472]
- 15. Molecular Diagnostic Tests for SARS-CoV-2 [https://www.fda.gov/medical-devices/covid-19-emergency-use-authorizations-medical-devices/in-vitro-diagnostics-euas-molecular-diagnostic-tests-sars-cov-2]
- 16. Current molecular diagnostics assays for SARS-CoV-2 and ... [https://pmc.ncbi.nlm.nih.gov/articles/PMC8655725/]
- 17. Comparative analysis of NAT reactivity and CLIA in ... [https://pubmed.ncbi.nlm.nih.gov/41170046/]
- 18. A guideline for reporting experimental protocols in life sciences [https://pmc.ncbi.nlm.nih.gov/articles/PMC5978404/]
- 19. Comparison of PCR with Other Nucleic Acid Amplification ... [https://www.mybiosource.com/learn/comparison-of-pcr-with-other-nucleic-acid-amplification-techniques/]
- 20. Isothermal nucleic acid amplification and its uses in ... [https://link.springer.com/article/10.1007/s13205-023-03628-6]
- 21. Isothermal Nucleic Acid Amplification Technology Market [https://www.novaoneadvisor.com/report/isothermal-nucleic-acid-amplification-technology-market]
- 22. Comparative study of different SARS-CoV-2 diagnostic ... [https://www.sciencedirect.com/science/article/abs/pii/S0166093421002202]
- 23. Isothermal Nucleic Acid Amplification Technology Market ... [https://www.precedenceresearch.com/isothermal-nucleic-acid-amplification-technology-market]
- 24. Recovery efficiencies of nucleic acid extraction kits as ... [https://pmc.ncbi.nlm.nih.gov/articles/PMC1187008/]
- 25. Selection and evaluation of an efficient method for the ... [https://www.nature.com/articles/s41541-018-0067-3]
- 26. Development and validation of a rapid five-minute nucleic ... [https://pmc.ncbi.nlm.nih.gov/articles/PMC11331601/]
- 27. Viral Nucleic Acid Isolation Kits [https://www.thermofisher.com/us/en/home/life-science/dna-rna-purification-analysis/viral-rna-dna-purification.html]
- 28. Utilizing tables, figures, charts and graphs to enhance the ... [https://pmc.ncbi.nlm.nih.gov/articles/PMC10394528/]
- 29. Top 6 Visualizations for Quantitative Data Analysis Methods [https://chartexpo.com/blog/quantitative-data-analysis-methods]
- 30. Insights into SARS-CoV-2 genome, structure, evolution ... [https://pmc.ncbi.nlm.nih.gov/articles/PMC7293463/]
- 31. Structural biology of SARS-CoV-2: open the door for novel ... [https://www.nature.com/articles/s41392-022-00884-5]
- 32. Structural biology of SARS-CoV-2 and implications for ... [https://www.nature.com/articles/s41579-021-00630-8]
- 33. Structural and non-structural proteins in SARS-CoV-2 [https://biosignaling.biomedcentral.com/articles/10.1186/s12964-023-01104-5]
- 34. Immunoinformatics Analysis of SARS-CoV-2 ORF1ab ... - PMC [https://pmc.ncbi.nlm.nih.gov/articles/PMC8704007/]
- 35. Genome-Wide Analysis of the Indispensable Role of Non- ... [https://www.frontiersin.org/journals/microbiology/articles/10.3389/fmicb.2022.907422/full]
- 36. SARS-CoV-2 Non-Structural Proteins and Their Roles in Host ... [https://pmc.ncbi.nlm.nih.gov/articles/PMC9506350/]
- 37. Comparative analysis of point-of-care, high-throughput and ... [https://pmc.ncbi.nlm.nih.gov/articles/PMC7885623/]
- 38. Comprehensive performance evaluation of a high ... [https://www.frontiersin.org/journals/microbiology/articles/10.3389/fmicb.2025.1609142/full]
- 39. Review article Molecular point-of-care devices for the ... [https://www.sciencedirect.com/science/article/pii/S1386653223002366]
- 40. Rapid deep learning-assisted predictive diagnostics for ... [https://www.nature.com/articles/s41467-024-46069-2]
- 41. Point‐of‐care nucleic acid testing – a step forward in ... [https://pmc.ncbi.nlm.nih.gov/articles/PMC11970346/]
- 42. Performance of point-of care molecular and antigen-based ... [https://pmc.ncbi.nlm.nih.gov/articles/PMC9660861/]
- 43. Machine learning in point-of-care testing: innovations, ... [https://www.nature.com/articles/s41467-025-58527-6]
- 44. Comparison of two nucleic acid amplification technology ... [https://pmc.ncbi.nlm.nih.gov/articles/PMC10936959/]
- 45. Blood Donation Screening of Transfusion-Transmissible ... [https://pmc.ncbi.nlm.nih.gov/articles/PMC10247654/]
- 46. The impact of nucleic acid testing to detect human ... [https://bmcinfectdis.biomedcentral.com/articles/10.1186/s12879-022-07279-5]
- 47. Optimization of Pooling Technique for Hepatitis C Virus ... [https://brieflands.com/journals/hepatmon/articles/99571]
- 48. Sensitivity of individual and mini-pool nucleic acid testing ... [https://pmc.ncbi.nlm.nih.gov/articles/PMC3943140/]
- 49. Comprehensive evaluation of NAT+/HBsAg– blood donors ... [https://bmcinfectdis.biomedcentral.com/articles/10.1186/s12879-025-11798-2]
- 50. Temporal dynamics of viral load and false negative rate ... [https://pmc.ncbi.nlm.nih.gov/articles/PMC8080800/]
- 51. Challenges and Implications of False Negative COVID-19 ... [https://health.ucdavis.edu/blog/lab-best-practice/challenges-and-implications-of-false-negative-covid-19-testing/2020/08]
- 52. When laboratory tests can mislead even when they appear ... [https://pmc.ncbi.nlm.nih.gov/articles/PMC6297641/]
- 53. Nucleic Acid–based Testing for Noninfluenza Viral Pathogens ... [https://pmc.ncbi.nlm.nih.gov/articles/PMC8314899/]
- 54. Research on safety strategies for nucleic acid testing in ... [https://www.nature.com/articles/s41598-024-71595-w]
- 55. Detection of occult hepatitis B in serum and oral fluid samples [https://pmc.ncbi.nlm.nih.gov/articles/PMC5719542/]
- 56. Effectiveness of PCR primers for the detection of occult ... [https://journals.plos.org/plosone/article?id=10.1371/journal.pone.0205356]
- 57. CROI 2025: The Challenges of Sustaining Viral ... [https://pmc.ncbi.nlm.nih.gov/articles/PMC12324711/]
- 58. Digital PCR provides absolute quantitation of viral load for ... [https://www.sciencedirect.com/science/article/abs/pii/S0166093411003922]
- 59. Programmable design of isothermal nucleic acid diagnostic ... [https://www.nature.com/articles/s41467-022-29101-1]
- 60. How to Work with Challenging or Limited Genomic ... [https://blog.omni-inc.com/blog/how-to-work-with-challenging-or-limited-genomic-samples-updated-for-2025]
- 61. Comparative evaluation of various DNA extraction methods ... [https://pmc.ncbi.nlm.nih.gov/articles/PMC11748555/]
- 62. A rapid and high-yield method for nucleic acid extraction [https://www.nature.com/articles/s41598-025-95226-0]
- 63. Development and validation of a rapid five-minute nucleic acid ... [https://virologyj.biomedcentral.com/articles/10.1186/s12985-024-02381-3]
- 64. Nucleic Acid Extraction Techniques - PMC [https://pmc.ncbi.nlm.nih.gov/articles/PMC7122149/]
- 65. Quantitative nucleic acid amplification methods and their ... [https://pmc.ncbi.nlm.nih.gov/articles/PMC5327603/]
- 66. Comparison of boiling versus magnetic bead techniques in ... [https://pmc.ncbi.nlm.nih.gov/articles/PMC12613369/]
- 67. Design and Application of Nucleic Acid Standards for ... [https://pmc.ncbi.nlm.nih.gov/articles/PMC3107435/]
- 68. Nucleic acid testing-benefits and constraints - PMC [https://pmc.ncbi.nlm.nih.gov/articles/PMC3943139/]
- 69. A methodology for deriving the sensitivity of pooled testing ... [https://translational-medicine.biomedcentral.com/articles/10.1186/s12967-019-1992-2]
- 70. Single Tube Multiplex PCR, Liquid Hybridization... | Research Square [https://www.researchsquare.com/article/rs-1708998/v1]
- 71. Standardization of Nucleic Acid Tests: the Approach ... [https://pmc.ncbi.nlm.nih.gov/articles/PMC6322456/]
- 72. An Explanation of Sensitivity and the LLD, LLOQ, and ULOQ of a Multiplex ELISA [https://www.quansysbio.com/support/explanation-of-sensitivity-lld-lloq-and-uloq/]
- 73. ELISA Kit Term: Limit of Detection | Sino Biological [https://www.sinobiological.com/category/elisa-kit-limit-of-detection]
- 74. Development of a validation protocol method for nucleic ... [https://pubmed.ncbi.nlm.nih.gov/36417607/]
- 75. Nucleic acid-based reference materials: A “ruler” for ... [https://www.sciencedirect.com/science/article/abs/pii/S0165993625001360]
- 76. CRISPR技术在临床诊断中的应用 [https://lifescience.sinh.ac.cn/202508/20250802.htm]
- 77. ƩS COVID-19 is a rapid high throughput and sensitive one- ... [https://www.nature.com/articles/s41598-024-71705-8]
- 78. Evaluation of analytical sensitivity and clinical performance [https://pmc.ncbi.nlm.nih.gov/articles/PMC8842162/]
- 79. Comparison and Sensitivity Evaluation of Three Different ... [https://pmc.ncbi.nlm.nih.gov/articles/PMC8309997/]
- 80. Dynamic changes of Ct values of N gene and ORF1ab ... [https://www.frontiersin.org/journals/microbiology/articles/10.3389/fmicb.2025.1606306/full]
- 81. Accuracy of saliva tests for SARS-CoV-2 diagnosis during ... [https://www.nature.com/articles/s41598-025-20841-w]
- 82. EU MDR vs FDA: 2025 US-EU Medical Device Regulatory ... [https://www.complizen.ai/post/eu-mdr-vs-fda-complete-regulatory-comparison-guide-2025]
- 83. CE Mark Versus FDA Approval: Which System Has it Right? [https://crstodayeurope.com/articles/2015-feb/ce-mark-versus-fda-approval-which-system-has-it-right/]
- 84. Microbiology Devices; Reclassification of Antigen, Antibody ... [https://www.federalregister.gov/documents/2025/09/18/2025-18082/microbiology-devices-reclassification-of-antigen-antibody-and-nucleic-acid-based-hepatitis-b-virus]
- 85. 2025 Biological Device Application Approvals [https://www.fda.gov/vaccines-blood-biologics/development-approval-process-cber/2025-biological-device-application-approvals]
- 86. Nucleic Acid Based Tests [https://www.fda.gov/medical-devices/in-vitro-diagnostics/nucleic-acid-based-tests]
- 87. FDA approves improvement to home colorectal cancer test ... [https://myadlm.org/cln/articles/2025/novemberdecember/fda-approves-improvement-to-home-colorectal-cancer-test-sample-collection]
- 88. Implementing External Quality Assessment (EQA) Programs ... [https://www.iscaconsortium.org/implementing-external-quality-assessment-eqa-programs-for-pcr-based-diagnostic-laboratories/]
- 89. External quality assessment for nucleic acid quantitative ... [https://pmc.ncbi.nlm.nih.gov/articles/PMC12269617/]
- 90. Proficiency Testing (PT)/External Quality Assessment (EQA ... [https://www.cap.org/laboratory-improvement/laboratories-outside-the-usa/proficiency-testing-pt-external-quality-assessment-eqa-programs]